Buyer and Seller Guides for Buying and Selling This Summer
Thursday, June 8, 2023
Add Comment
Liz Warren
Displaying blog entries 251-260 of 1996

When you look at the numbers today, the one thing that stands out is the strength of this housing market. We can see this is one of the most foundationally strong housing markets of our lifetime – if not the strongest housing market of our lifetime. Here are two fundamentals that prove this point.
First, let’s look at the current rate on existing mortgages. According to the Federal Housing Finance Agency (FHFA), as of the fourth quarter of last year, over 80% of existing mortgages have a rate below 5%. That’s significant. And, to take that one step further, over 50% of mortgages have a rate below 4% (see graph below):
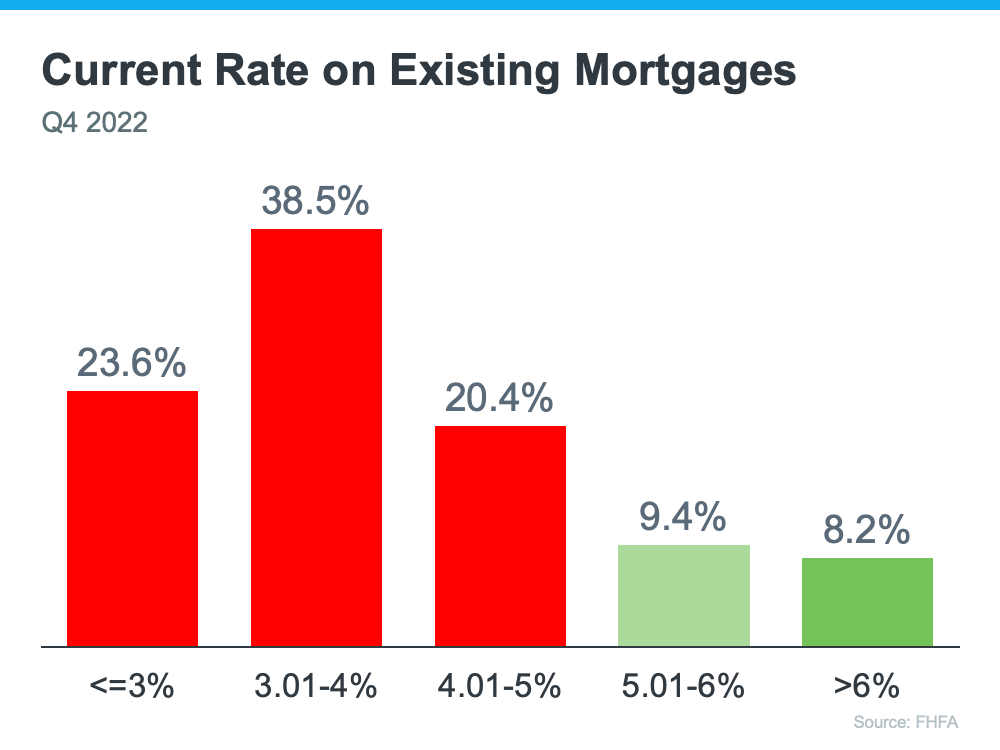
Now, there’s a lot of talk in the media about a potential foreclosure crisis or a rise of homeowners defaulting on their loans, but consider this. Homeowners with such good mortgage rates are going to work as hard as they can to keep that mortgage and stay in their homes. That’s because they can't go out and buy another house, or even rent an apartment, and pay what they do today. Their current mortgage payment is more affordable. Even if they downsize, with today’s higher mortgage rates, it could cost more.
Here's why this gives the housing market such a solid foundation today. Having so many homeowners with such low mortgage rates helps us avoid a crisis with a flood of foreclosures coming to market like there was back in 2008.
Second, Americans are sitting on tremendous equity right now. According to the Census and ATTOM, roughly two-thirds (around 68%) of homeowners have either paid off their mortgage or have at least 50% equity (see chart below):
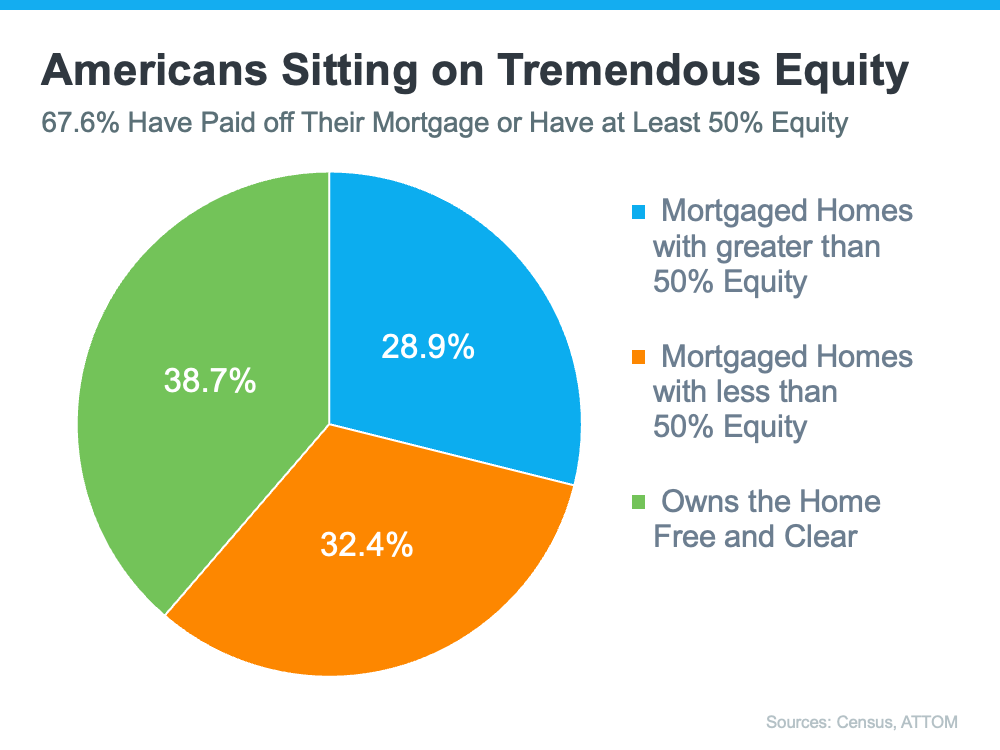
In the industry, the term for this is equity rich. This is significant because if you think back to 2008, some people had to make the difficult decision to walk away from their homes because they owed more on the home than it was worth.
But this time, things are different because homeowners have built up so much equity over the past few years alone. And, when homeowners have that much equity, it helps us avoid another wave of distressed properties coming onto the market like we saw during the crash. It also creates an extremely strong foundation for today’s housing market.
We are in one of the most foundationally strong housing markets of our lifetime because homeowners are going to fight to keep their current mortgage rate and they have a tremendous amount of equity. This is yet another reason things are fundamentally different than in 2008.

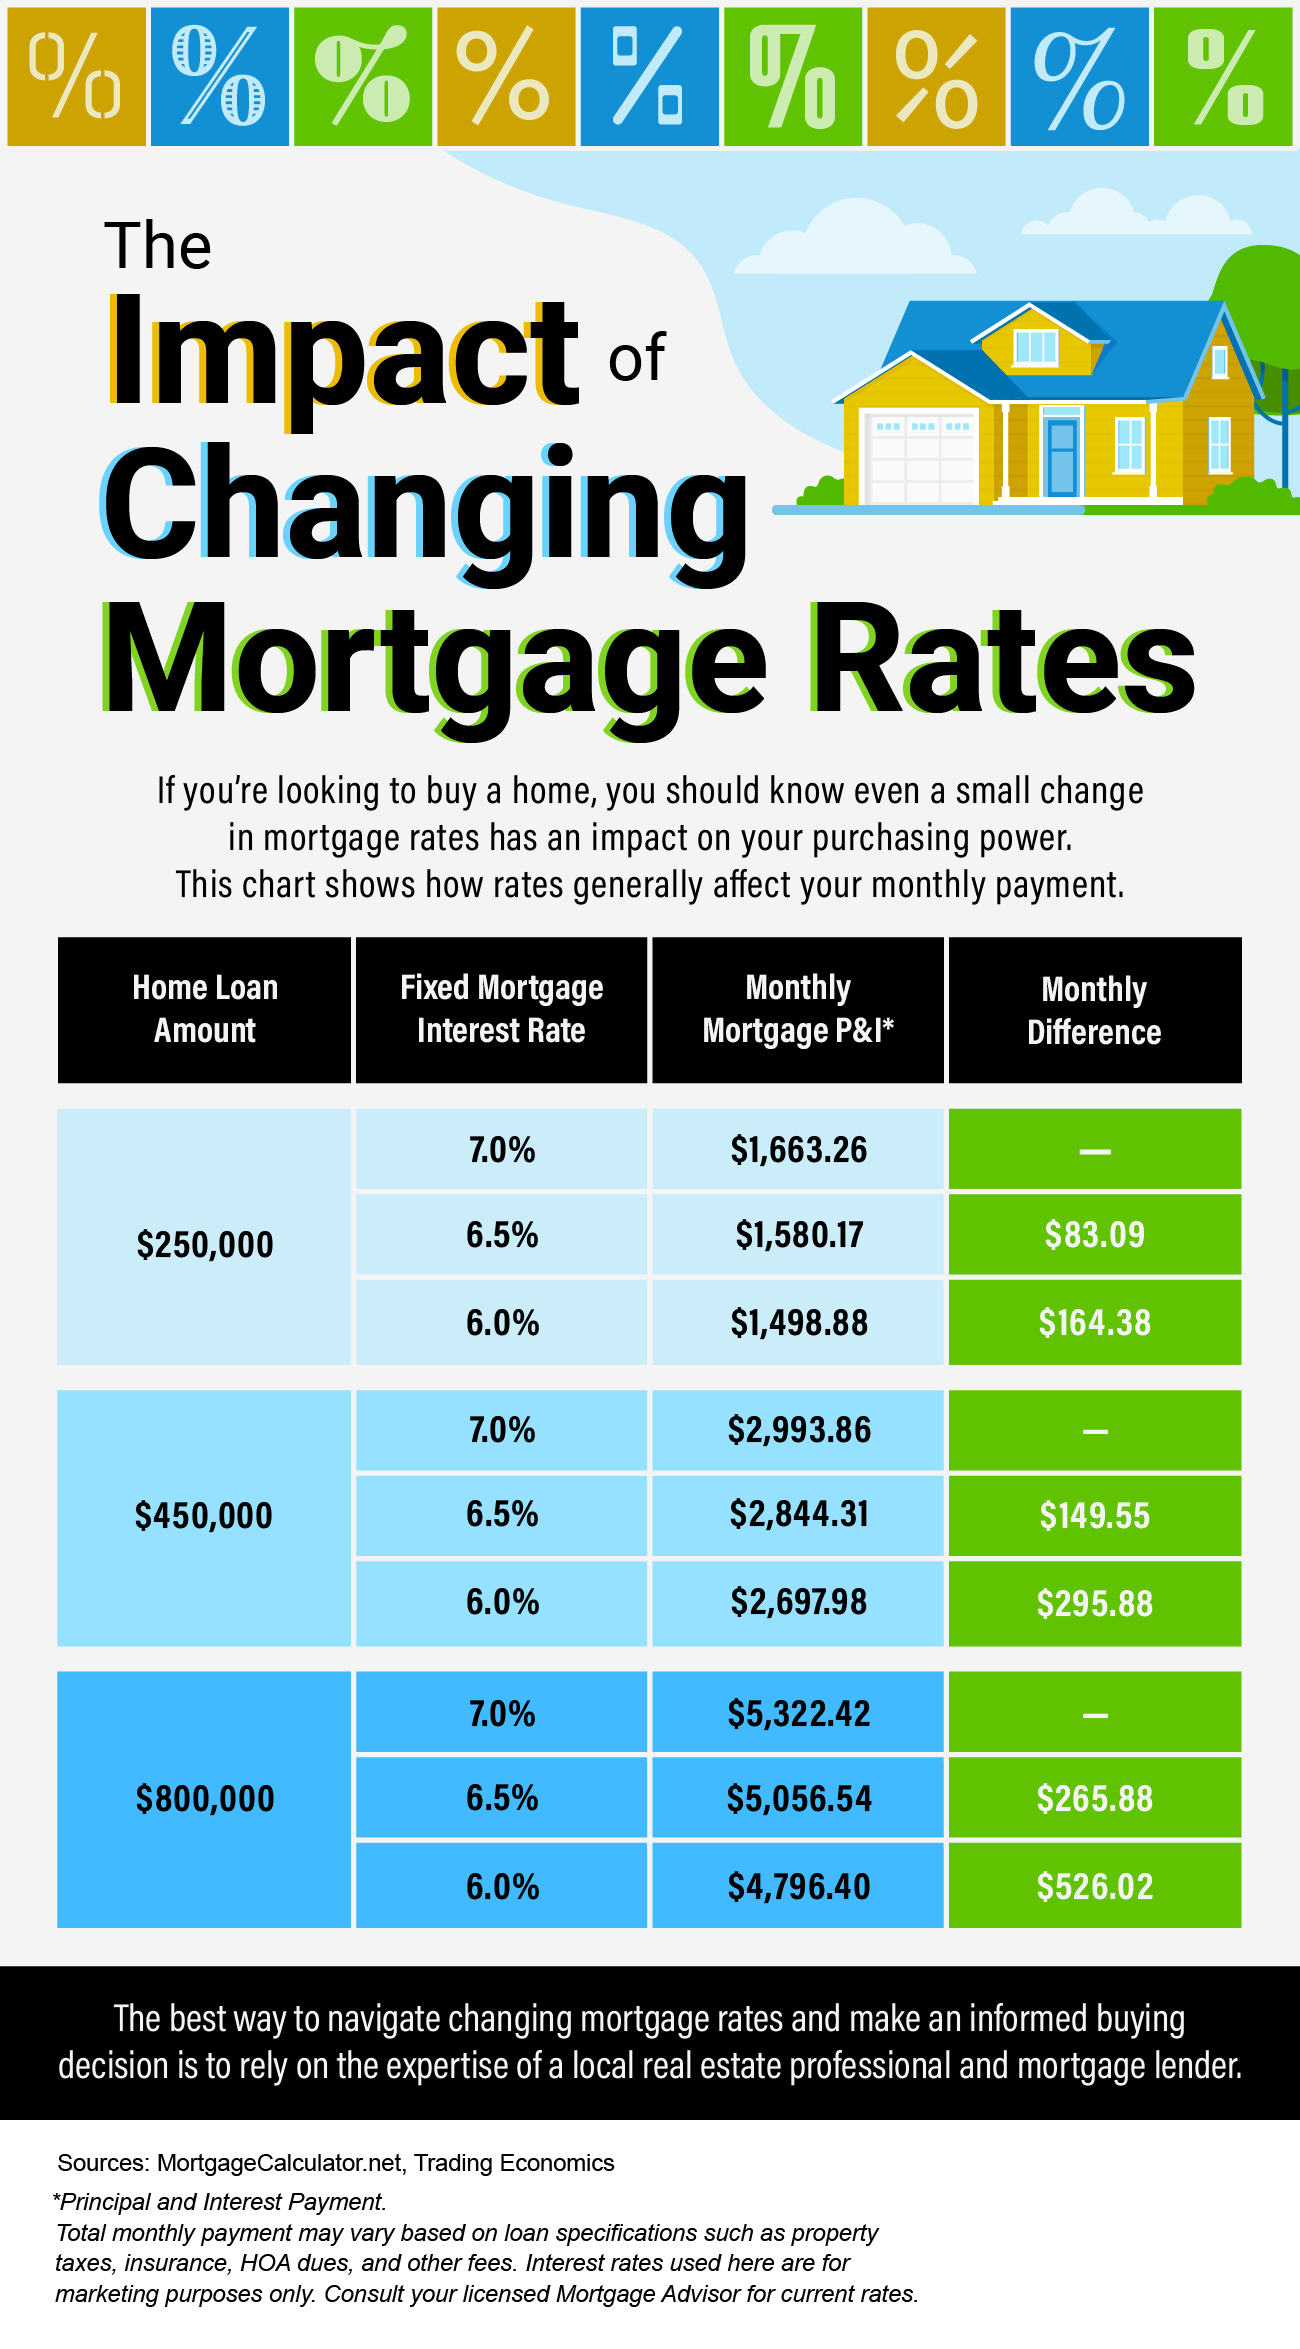
Today’s mortgage rates are top-of-mind for many homebuyers right now. As a result, if you’re thinking about buying for the first time or selling your current house to move into a home that better fits your needs, you may be asking yourself these two questions:
Here’s context you need to help answer those questions.
The 30-year fixed-rate mortgage is largely influenced by the supply and demand for mortgage-backed securities (MBS). According to Investopedia:
“Mortgage-backed securities (MBS) are investment products similar to bonds. Each MBS consists of a bundle of home loans and other real estate debt bought from the banks that issued them . . . The investor who buys a mortgage-backed security is essentially lending money to home buyers.”
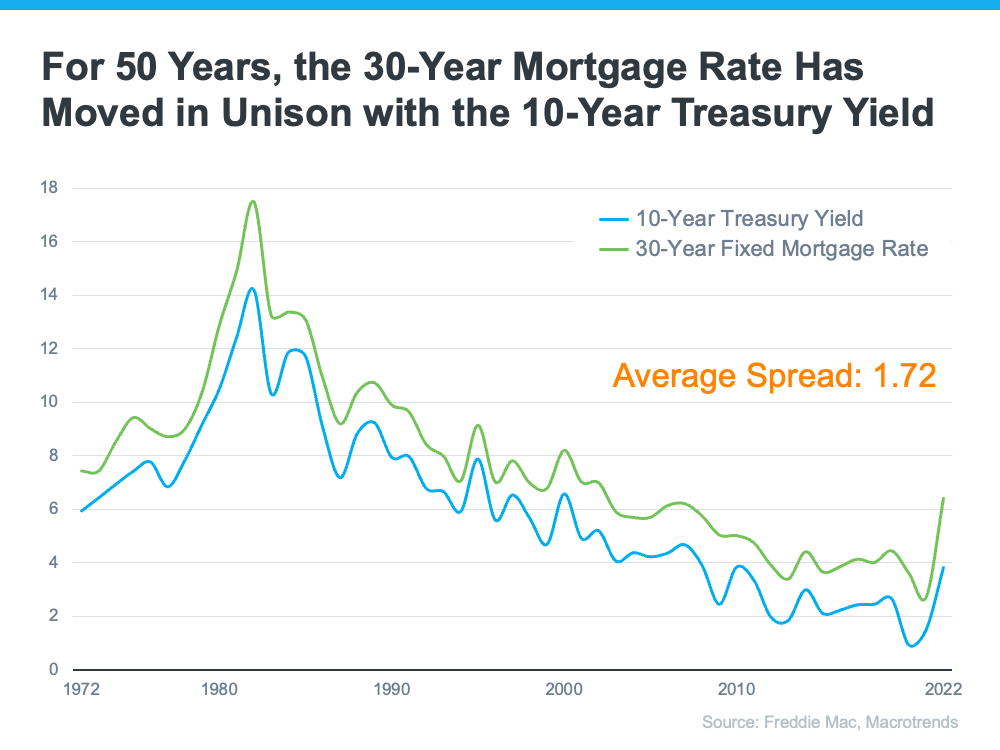
Demand for MBS helps determine the spread between the 10-Year Treasury Yield and the 30-year fixed mortgage rate. Historically, the average spread between the two is 1.72 (see chart below):
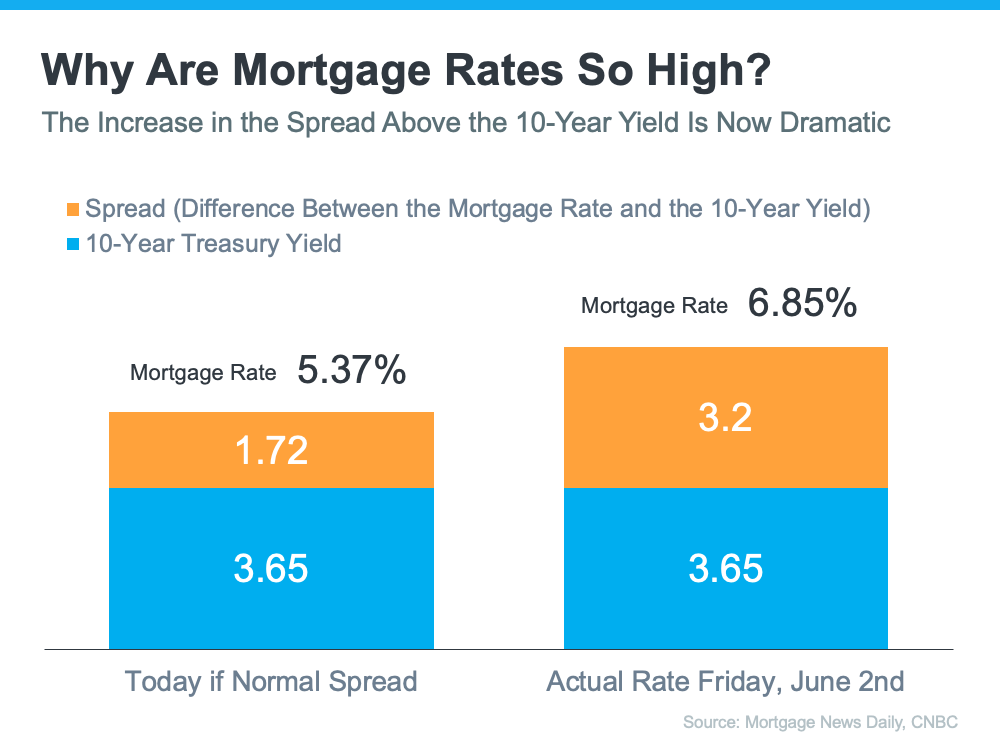
Last Friday morning, the mortgage rate was 6.85%. That means the spread was 3.2%, which is almost 1.5% over the norm. If the spread was at its historical average, mortgage rates would be 5.37% (3.65% 10-Year Treasury Yield + 1.72 spread).
This large spread is very unusual. As George Ratiu, Chief Economist at Keeping Current Matters (KCM), explains:
“The only times the spread approached or exceeded 300 basis points were during periods of high inflation or economic volatility, like those seen in the early 1980s or the Great Financial Crisis of 2008-09."
The graph below uses historical data to help illustrate this point by showing the few times the spread has increased to 300 basis points or more:
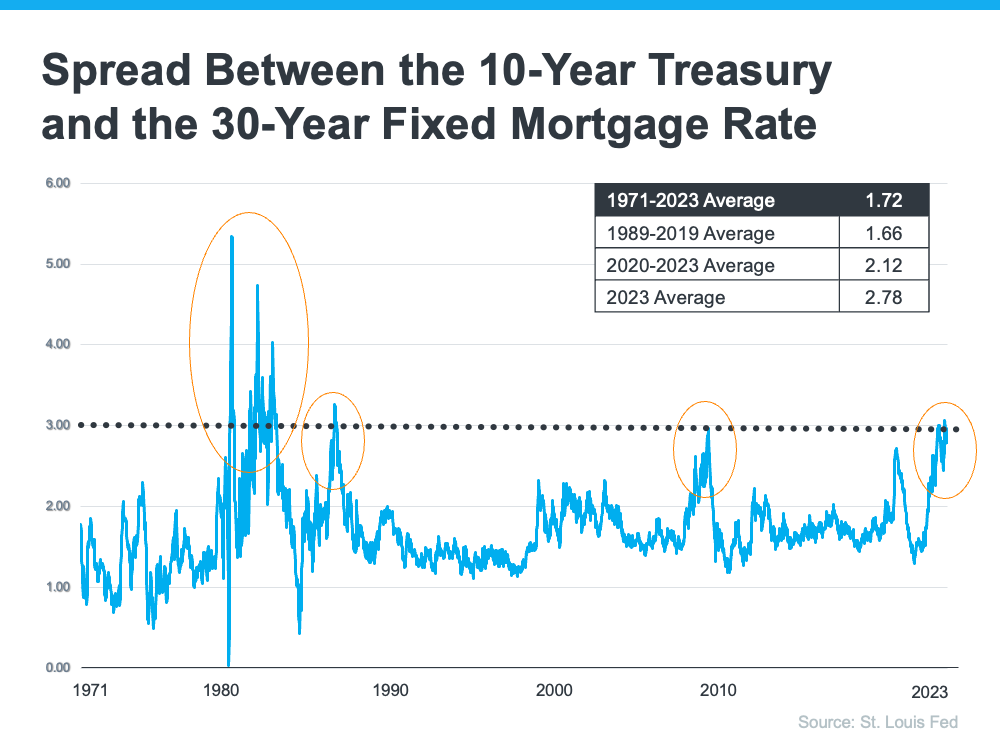
The graph shows how the spread has come down after each peak. The good news is, that means there’s room for mortgage rates to improve today.
So, what’s causing the larger spread and making mortgage rates so high today?
The demand for MBS is heavily influenced by the risks associated with investing in them. Today, that risk is impacted by broader market conditions like inflation and fear of a potential recession, the Fed’s interest rate hikes to try to bring down inflation, headlines that create unnecessarily negative narratives about home prices, and more.
Simply put: when there’s less risk, demand for MBS is high, so mortgage rates will be lower. On the other hand, if there’s more risk with MBS, demand for MBS will be low, and we’ll see higher mortgage rates as a result. Currently, demand for MBS is low, so mortgage rates are high.
Odeta Kushi, Deputy Chief Economist at First American, answers that question in a recent blog:
“It’s reasonable to assume that the spread and, therefore, mortgage rates will retreat in the second half of the year if the Fed takes its foot off the monetary tightening pedal and provides investors with more certainty. However, it’s unlikely that the spread will return to its historical average of 170 basis points, as some risks are here to stay.”
The spread will shrink when the fear investors feel is eased. That’ll mean we should see mortgage rates moderate as the year goes on. However, when it comes to forecasting mortgage rates, no one can know for sure exactly what will happen.

During the fourth quarter of last year, many housing experts predicted home prices were going to crash this year. Here are a few of those forecasts:
Jeremy Siegel, Russell E. Palmer Professor Emeritus of Finance at the Wharton School of Business:
“I expect housing prices fall 10% to 15%, and the housing prices are accelerating on the downside.”
Mark Zandi, Chief Economist at Moody’s Analytics:
"Buckle in. Assuming rates remain near their current 6.5% and the economy skirts recession, then national house prices will fall almost 10% peak-to-trough. Most of those declines will happen sooner rather than later. And house prices will fall 20% if there is a typical recession.”
“Housing is already cooling in the U.S., according to July data that was reported last week. As interest rates climb steadily higher, Goldman Sachs Research’s G-10 home price model suggests home prices will decline by around 5% to 10% from the peak in the U.S. . . . Economists at Goldman Sachs Research say there are risks that housing markets could decline more than their model suggests.”
These forecasts put doubt in the minds of many consumers about the strength of the residential real estate market. Evidence of this can be seen in the December Consumer Confidence Survey from Fannie Mae. It showed a larger percentage of Americans believed home prices would fall over the next 12 months than in any other December in the history of the survey (see graph below). That caused people to hesitate about their homebuying or selling plans as we entered the new year.
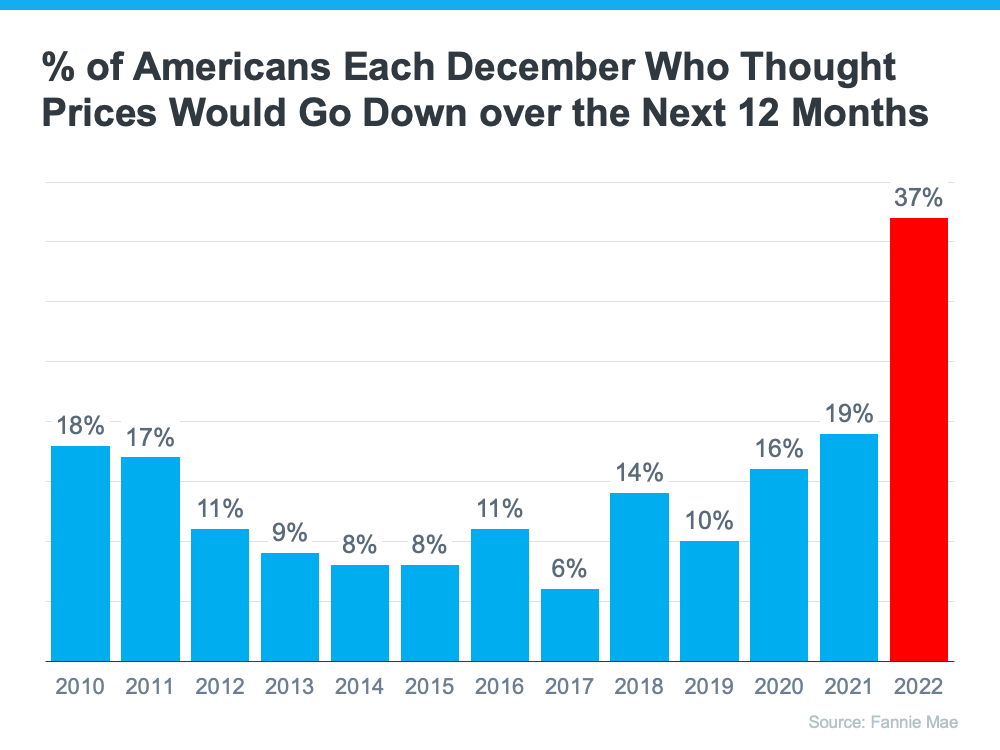
However, home prices didn’t come crashing down and seem to be already rebounding from the minimal depreciation experienced over the last several months.
In a report just released, Goldman Sachs explained:
“The global housing market seems to be stabilizing faster than expected despite months of rising mortgage rates, according to Goldman Sachs Research. House prices are defying expectations and are rising in major economies such as the U.S.,. . . ”
Those claims from Goldman Sachs were verified by the release last week of two indexes on home prices: Case-Shiller and the FHFA. Here are the numbers each reported:
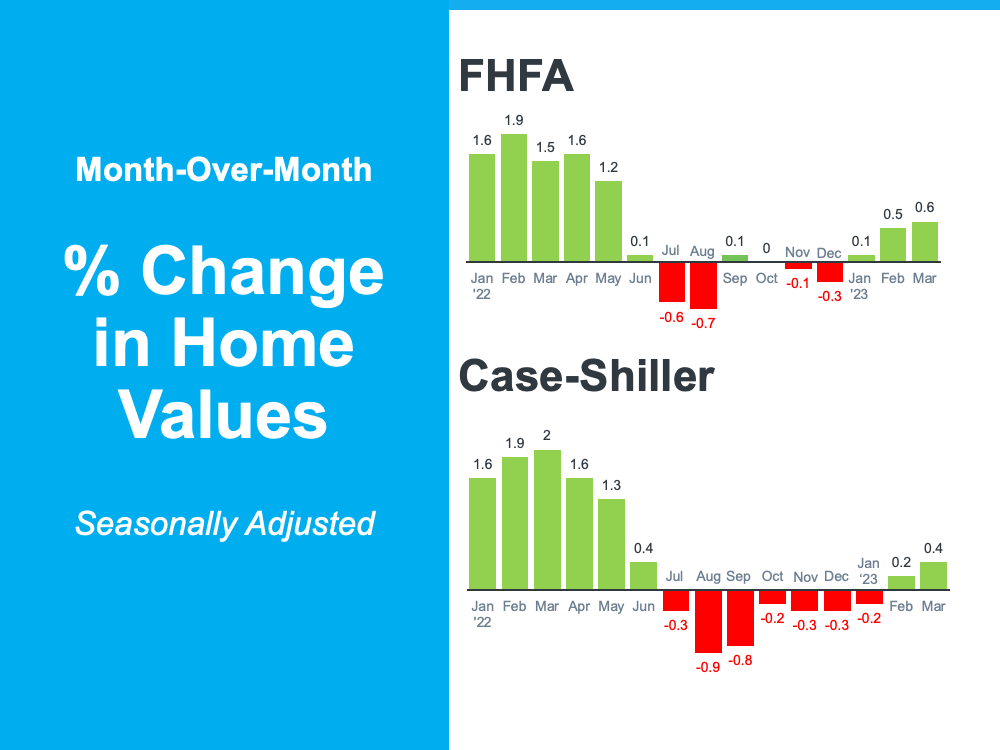
Home values seem to have turned the corner and are headed back up.
When the forecasts of significant home price depreciation were made last fall, they were made with megaphones. Mass media outlets, industry newspapers, and podcasts all broadcasted the news of an eminent crash in prices.
Now, forecasters are saying the worst is over and it wasn’t anywhere near as bad as they originally projected. However, they are whispering the news instead of using megaphones. As real estate professionals, it is our responsibility – some may say duty – to correct this narrative in the minds of the American consumer.
I just read this recent article by KOIN on the cites with the fastest growing home prices in the Portland-Vancouver area. Our Mt. Hood area dominates the landscape with the following stats:


Most impressive was the five year price change with all in the over 50% range!
Camus, Washington placed # 1 and Dundee, Oregon placed # 2.
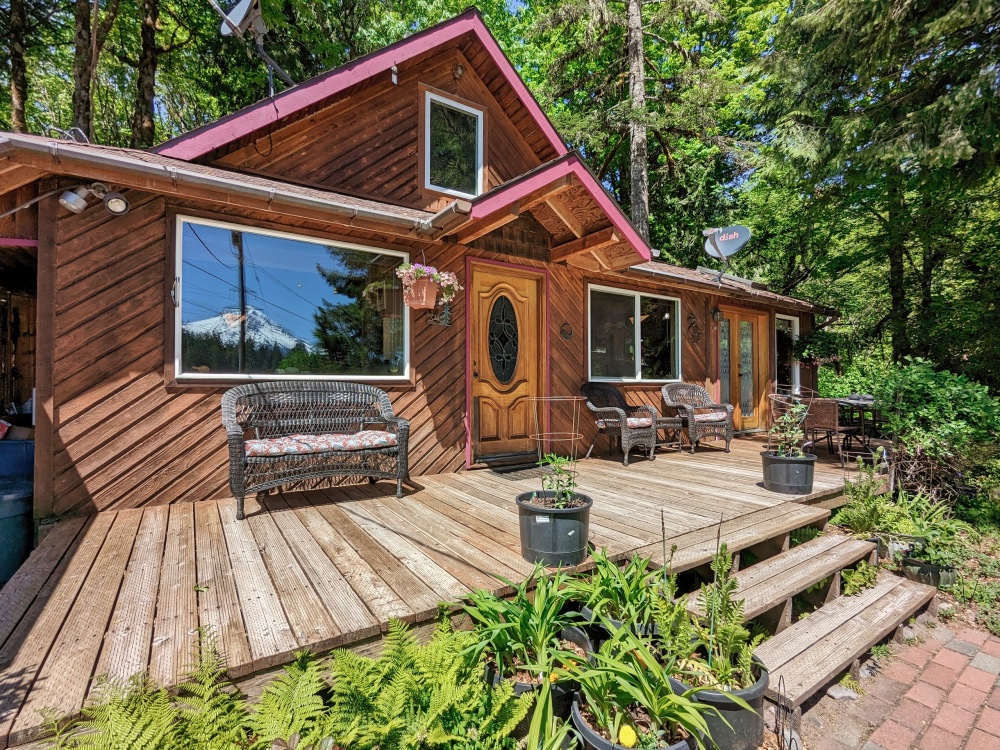
$510,000
.jpeg)
.jpeg)
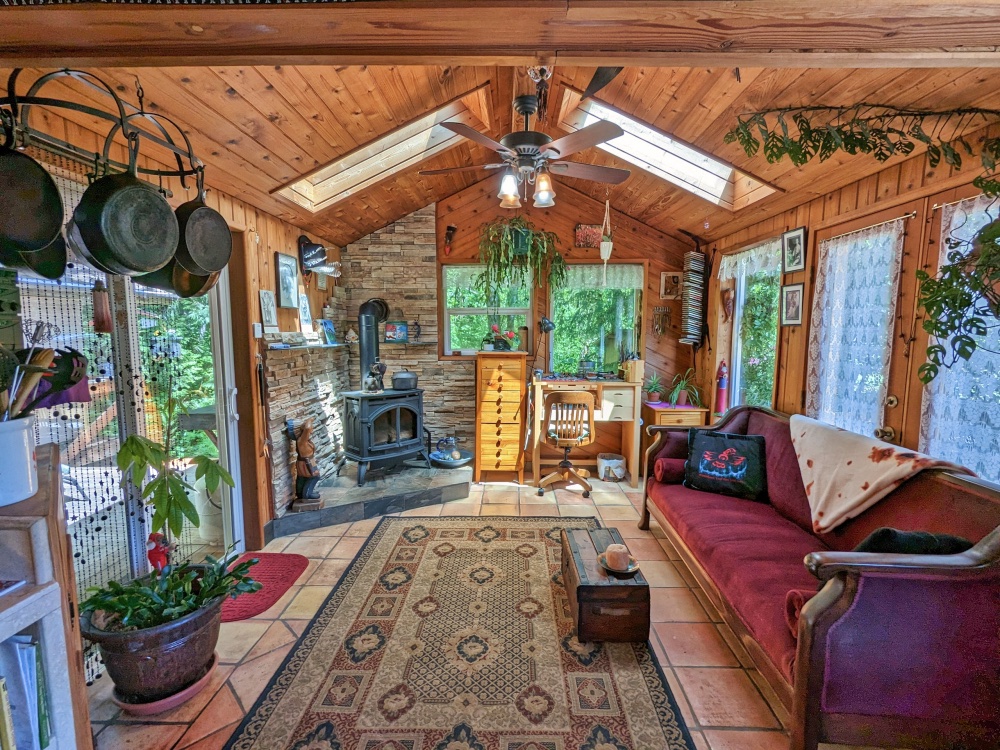
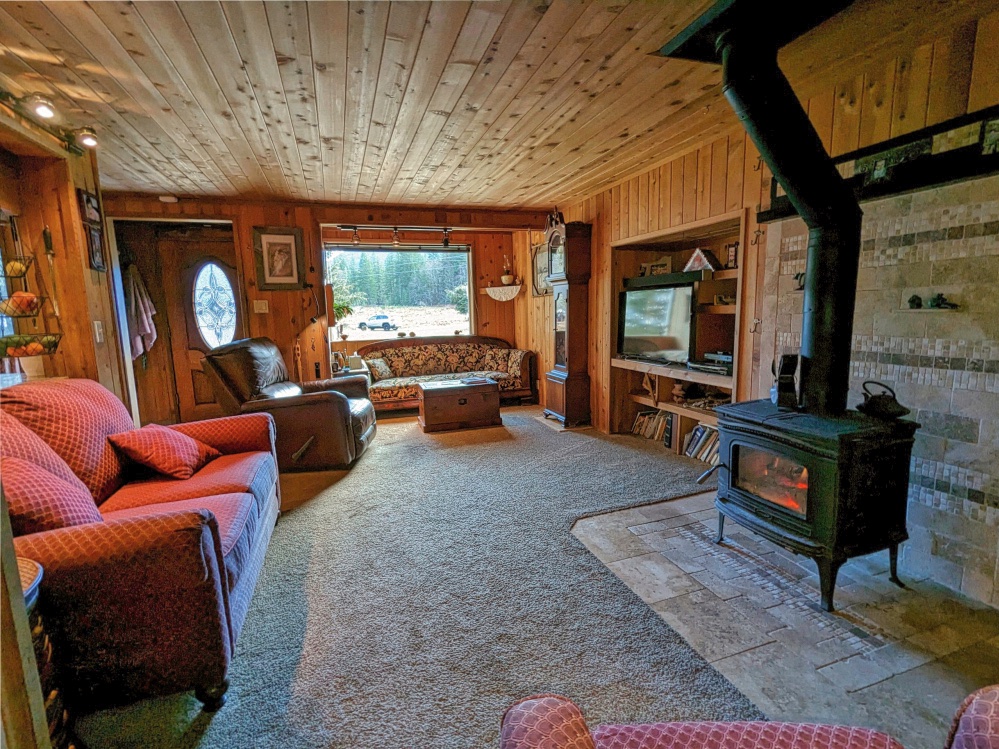
Discover the perfect blend of cabin charm and modern comforts in this two-bedroom, one-and-a-half-bath craftsman style home. Nestled on three quarters of an acre of land, this property offers views of Mt.Hood and foothills. Custom tile work and lots of wood throughout adds mountain touches to this custom home. The open floor plan blends the living, dining, kitchen and family room. The living room features a cozy wood stove, perfect for chilly evenings. I love the family room with tons of light and a new propane stove to warm your toes. French doors on one side plus a slider takes you steps to the back deck. Bonus workshop and storage area connected house. The kitchen has lots of cabinets, tile counter tops, plus a gas stove for cooking.The upstairs is a true haven, offering ample space that could easily be divided into two separate bedrooms, office or den. The master is on the main level. The property has tons of sun plus tall trees in the back yard near the creek. There?s even a fire pit. Multiple decks too! On the front deck watch the sun setting on Mt. Hood and on the back enjoy a private covered hot tub to enjoy the sounds of Clear Creek in the background. The homestead includes three quarters of an acre of land, providing plenty of space for outdoor activities. A sunny fenced raised bed garden area makes growing easy. The property has an updated septic system and a shared well. There?s a spacious woodshed for storage. A double carport attached to the house keeps the snow off your cars in winter. BPA easement on portion of property.This location is conveniently located near all Mt. Hood amenities with hiking and mountain biking down the road. Only 20 minutes to the ski slopes of Mt. Hood. Cross country skiing out your front door. Sandy Ridge Mountain Biking park minutes away too! A 27 hole golf course is only seven minutes away. A world away from hustle and bustle but stores and restaurants not far away. Get out of the city and enjoy life on the mountain!

Displaying blog entries 251-260 of 1996