Real Estate Information Archive

Blog

Displaying blog entries 411-420 of 1876

Lack of Supply on Mt. Hood

by Liz Warren

This Isn’t a Bubble. It’s Simply Lack of Supply. 

This Isn’t a Bubble. It’s Simply Lack of Supply. [INFOGRAPHIC] | MyKCM
 

Some Highlights

  • In a recent article, Lawrence Yun, Chief Economist for the National Association of Realtors (NAR), discussed the state of today’s housing market.
  • When addressing whether or not today’s high buyer competition and rising home prices are evidence of a housing bubble, Yun said that this “is not a bubble. It is simply lack of supply.”
  • Today’s housing market is healthy, and rising prices are driven by real buyer demand. Let’s connect to talk about the best ways to navigate such an energetic market.

Stock Market or Real Estate for Investment

by Liz Warren

Salmon Riverfront 1925 Cabin in Brightwood

by Liz Warren

Once in a blue moon we get a wonderful property like this right along the banks of the Salmon River. This charming cabin was built in 1925 yet all of todays modern amenities. Two bedrooms and two baths with around 1200 sq. ft. , this cabin has an open floor plan on the main level with river rock fireplace, skylights and a cozy kitchen complete with gas  cooking stove. 

The outside is amazing with a hot tub perched right above the river so you can watch the ducks float by. A stoned fire pit and picnic table are the perfect place for lunches and marsh mellows in the evenings. 

This cabin has been a successful nightly vacation rental too! Only 20 minutes to the slopes of Mt. Hood and close to Internationally known Sandy Ridge Mountain Biking Park. $495,000

Living room of a 1925 cabin on the Salmon River

Salmon Riverfront Cabin in Brightwood Oregon

Salmon Riverfront Cabin

Build Wealth Through Home Ownership on Mt. Hood

by Liz Warren

Building Wealth on Mt. Hood

Owning a home is one of the best ways to build long-term wealth. In fact, year after year, homeowners continue to have far more wealth than renters do. If you’re in a position to buy a home, there’s no doubt it’s one of the best investments you can make. Ask your questions about homeownership so we can get started on the process today.

Top Four Reasons to Own a Home on Mt. Hood

by Liz Warren


Good News for Sellers on Mt. Hood

by Liz Warren

Buyer Competition Is Good News

for Sellers on Mt. Hood

Buyer Competition Is Good News for Sellers [INFOGRAPHIC] | MyKCM
 

Some Highlights

  • With so many buyers looking for homes to purchase and so few houses available today, there’s a substantial increase in bidding wars, and homes are selling fast.
  • According to the latest Realtors Confidence Index Survey from the National Association of Realtors (NAR), on average, houses are receiving over four offers from buyers and they’re selling in less than three weeks.
  • If you’re ready to make a move, let’s connect today so you can sell your house while the market is in your favor.

Zig Zag Riverfront Cabin

by Liz Warren

Zig Zag RIVERFRONT CABIN 

$319,950


Zig Zag Riverfront Cabin in the Mt. Hood National Forest

Enjoy this charming three bedroom cabin along the banks of the Zig Zag River and only 10 minutes to the slopes of Mt. Hood. High vaulted ceilings with three private bedrooms plus bonus loft over living room. Super updated kitchen and bath plus bonus screened in porch out back. 

Located in the Mt. Hood National Forest on leased land. Get back to nature and relax!

Sandy Riverfront Craftsman Home on Mt. Hood

by Liz Warren

Stunning Craftsman Sandy Riverfront home in Rhododendron. Three Bedrooms, two baths with tons of windows for natural light throughout. Soaring 25 foot ceilings and huge timbers in the great room. Stacked stone fireplace and wood floors too. Amazing views of river from your living room and master bedroom! $675,000!


Custom Craftsman Sandy Rivefrront home on Mt. Hood


Sandy Riverfront Great Room        Craftsman Home on the Sandy River dining room and kitchen


Worried About Lending?

by Liz Warren

There’s No Reason To Panic Over Today’s Lending Standards

There’s No Reason To Panic Over Today's Lending Standards | MyKCM
 

Today, some are afraid the real estate market is starting to look a lot like it did in 2006, just prior to the housing crash. One of the factors they’re pointing to is the availability of mortgage money. Recent articles about the availability of low down payment loans and down payment assistance programs are causing fear that we’re returning to the bad habits seen 15 years ago. Let’s alleviate these concerns.

Several times a year, the Mortgage Bankers Association releases an index titled The Mortgage Credit Availability Index (MCAI). According to their website:

“The MCAI provides the only standardized quantitative index that is solely focused on mortgage credit. The MCAI is…a summary measure which indicates the availability of mortgage credit at a point in time.”

Basically, the index determines how easy it is to get a mortgage. The higher the index, the more available mortgage credit becomes. Here’s a graph of the MCAI dating back to 2004, when the data first became available:There’s No Reason To Panic Over Today's Lending Standards | MyKCMAs we can see, the index stood at about 400 in 2004. Mortgage credit became more available as the housing market heated up, and then the index passed 850 in 2006. When the real estate market crashed, so did the MCAI (to below 100) as mortgage money became almost impossible to secure. Thankfully, lending standards have eased somewhat since. The index, however, is still below 150, which is about one-sixth of what it was in 2006.

Why did the index rage out of control during the housing bubble?

The main reason was the availability of loans with extremely weak lending standards. To keep up with demand in 2006, many mortgage lenders offered loans that put little emphasis on the eligibility of the borrower. Lenders were approving loans without always going through a verification process to confirm if the borrower would likely be able to repay the loan.

Some of these loans offered attractive, low interest rates that increased over time. The loans were popular because they could be obtained quickly and without the borrower having to provide documentation up front. However, as the rates increased, borrowers struggled to pay their mortgages.

Today, lending standards are much tighter. As Investopedia explains, the risky loans given at that time are extremely rare today, primarily because lending standards have drastically improved:

“In the aftermath of the crisis, the U.S. government issued new regulations to improve standard lending practices across the credit market, which included tightening the requirements for granting loans.”

An example of the relaxed lending standards leading up to the housing crash is the FICO® credit score associated with a loan. What’s a FICO® score? The website myFICO explains:

“A credit score tells lenders about your creditworthiness (how likely you are to pay back a loan based on your credit history). It is calculated using the information in your credit reports. FICO® Scores are the standard for credit scores—used by 90% of top lenders.”

During the housing boom, many mortgages were written for borrowers with a FICO score under 620. Experian reveals that, in today’s market, lenders are more cautious about lower credit scores:

“Statistically speaking, 28% of consumers with credit scores in the Fair range are likely to become seriously delinquent in the future…Some lenders dislike those odds and choose not to work with individuals whose FICO® Scores fall within this range.”

There are definitely still loan programs that allow a 620 score. However, lending institutions overall are much more attentive about measuring risk when approving loans. According to Ellie Mae’s latest Origination Insight Report, the average FICO® score on all loans originated in February was 753.

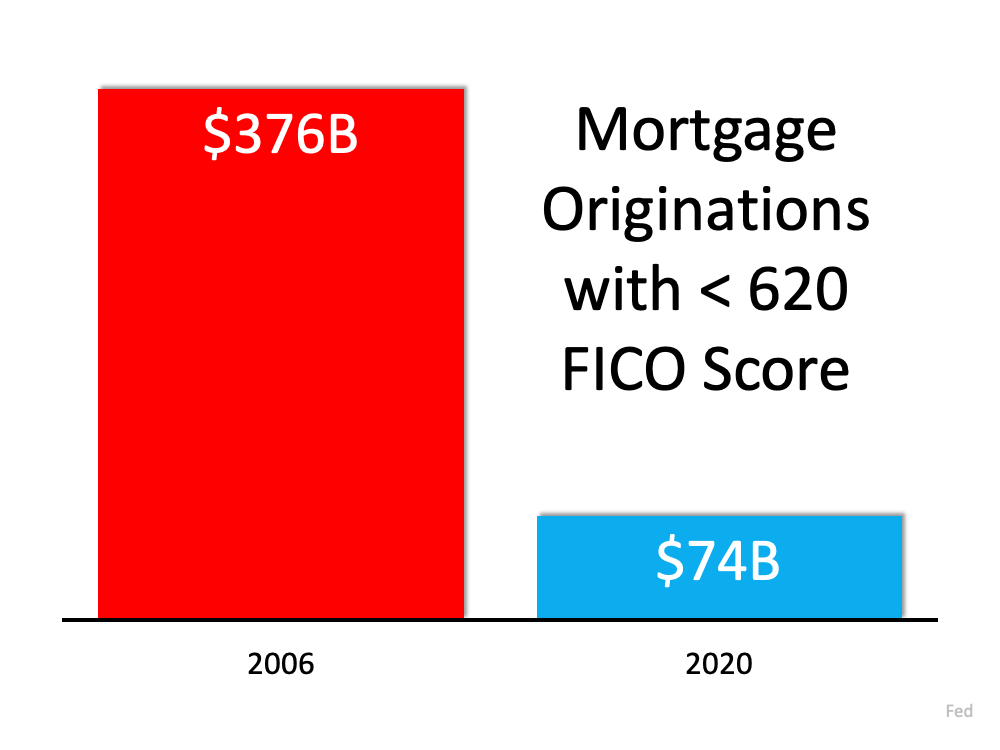
The graph below shows the billions of dollars in mortgage money given annually to borrowers with a credit score under 620.There’s No Reason To Panic Over Today's Lending Standards | MyKCMIn 2006, mortgage entities originated $376 billion dollars in loans for purchasers with a score under 620. Last year, that number was only $74 billion.

Bottom Line

In 2006, lending standards were much more relaxed with little evaluation done to measure a borrower’s potential to repay their loan. Today, standards are tighter, and the risk is reduced for both lenders and borrowers. These are two very different housing markets, so there’s no need to panic over today’s lending standards.

Cash Out Refis Surge

by Liz Warren

Should We Fear the Surge in Cash-Out Refinances?

Should We Fear the Surge in Cash-Out Refinances? | MyKCM
 

Freddie Mac recently released their Quarterly Refinance Statistics report which covers refinances through 2020. The report explains that the dollar amount of cash-out refinances was greater in 2020 than in recent years. A cash-out refinance, as defined by Investopia, is:

“a mortgage refinancing option in which an old mortgage is replaced for a new one with a larger amount than owed on the previously existing loan, helping borrowers use their home mortgage to get some cash.”

The Freddie Mac report led to articles like the one published by The Real Deal titled, House or ATM? Cash-Out Refinances Spiked in 2020, which reports:

“Americans treated their homes like ATMs last year, withdrawing $152.7 billion amid a cash-out refinancing spree not seen since before the 2008 financial crisis.”

Whenever you combine the terms “spiked,” “homes like ATMs,” and “financial crisis,” it conjures up memories of the housing crash we experienced in 2008.

However, that comparison is invalid for three reasons:

1. Americans are sitting on much more home equity today.

Mortgage data giant Black Knight just issued information on the amount of tappable equity U.S. homeowners with a mortgage have. Tappable equity is the amount of equity available for homeowners to use and still have 20% equity in their home. Here’s a graph showing the findings from their report:In 2006, directly before the crash, tappable home equity in the U.S. topped out at $4.6 trillion. Today, that number is $7.3 trillion.

As Black Knight explains:

“At year’s end, some 46 million homeowners held a total $7.3 trillion in tappable equity, the largest amount ever recorded...That’s an increase of more than $1.1 trillion (+18%) since the end of 2019, the largest percentage gain since 2013 and – you guessed it – the largest dollar value gain in history, to boot. All in all, it works out to roughly $158,000 on average per homeowner with tappable equity, up nearly $19,000 from the end of 2019.”

2. Homeowners cashed-out a much smaller amount this time.

In 2006, Americans cashed-out a total of $321 billion. In 2020, that number was less than half, totaling $153 billion. The $321 billion made up 7% of the total tappable equity in the country in 2006. On the other hand, the $153 billion made up only 2% of the total tappable equity last year.

3. Fewer homeowners tapped their equity in 2020 than in 2006.

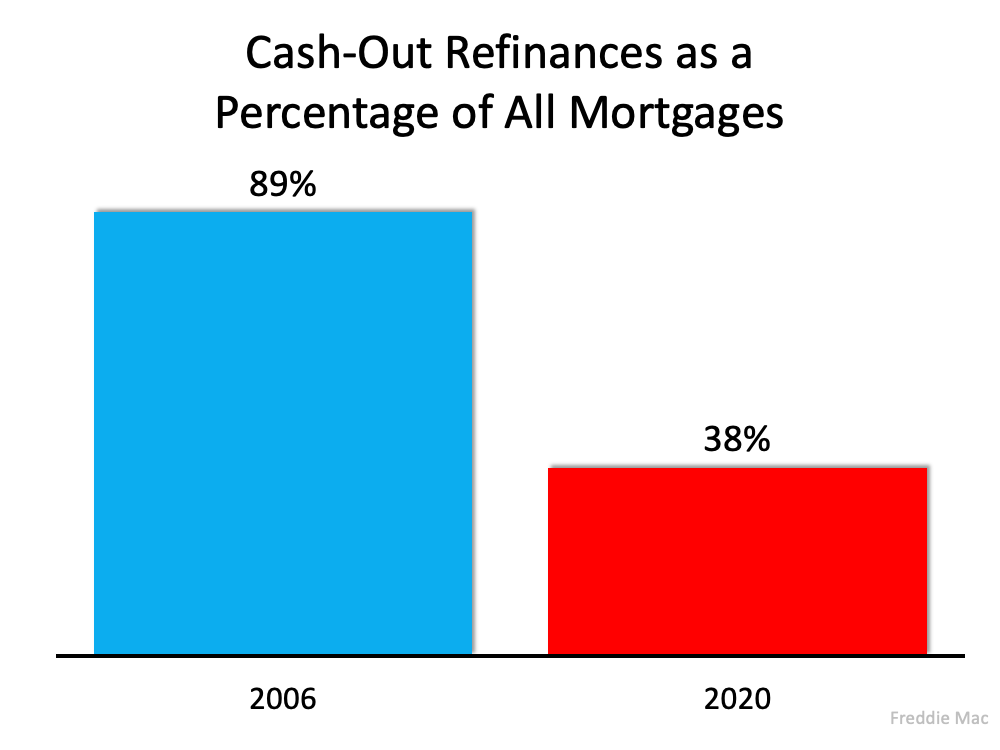
Freddie Mac reports that 89% of refinances in 2006 were cash-out refinances. Last year, that number was less than half at 33%. As a percentage of those who refinanced, many more Americans lowered their equity position fifteen years ago as compared to last year.

Bottom Line

It’s true that many Americans liquidated a portion of the equity in their homes last year for various reasons. However, less than half of them tapped their equity compared to 2006, and they cashed-out less than one-third of that available equity. Today’s cash-out refinance situation bears no resemblance to the situation that preceded the housing crash.

Displaying blog entries 411-420 of 1876

Syndication

Categories

Archives