Owning or Renting on Mt. Hood
Owning Is More Affordable than Renting in the Majority of the Country

If you were thinking about buying a home this year, but already pressed pause on your plans due to rising home prices and increasing mortgage rates, there’s something you should consider. According to the latest report from ATTOM Data, owning a home is more affordable than renting in the majority of the country. The 2022 Rental Affordability Report says:
“. . . Owning a median-priced home is more affordable than the average rent on a three-bedroom property in 666, or 58 percent, of the 1,154 U.S. counties analyzed for the report. That means major home ownership expenses consume a smaller portion of average local wages than renting.”
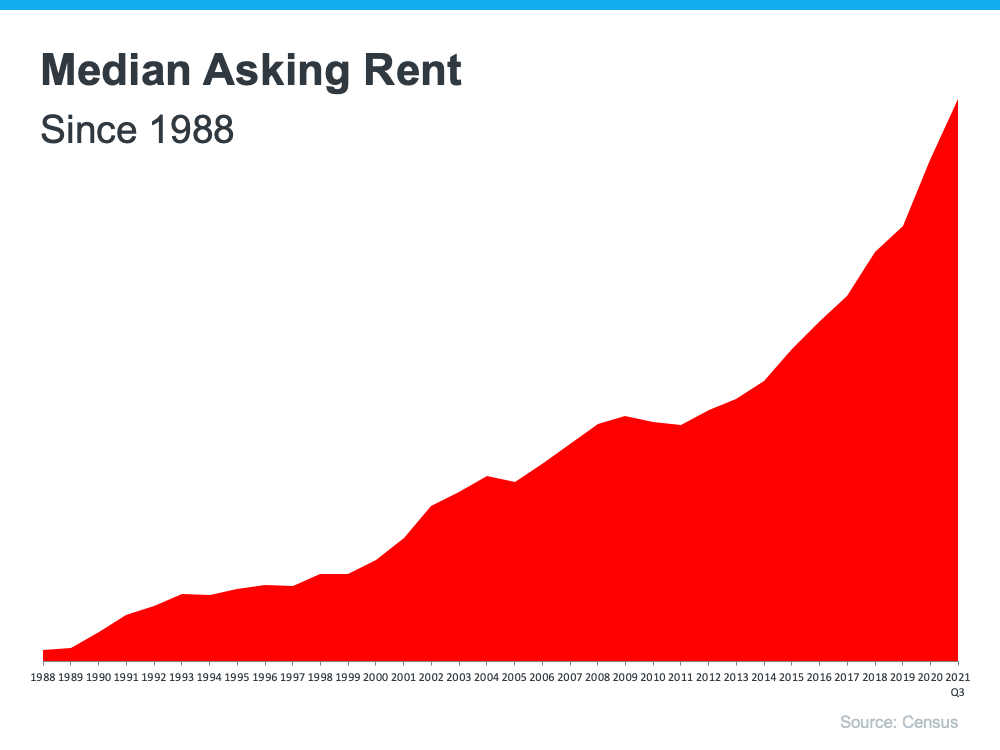
Other experts in the industry offer additional perspectives on renting today. In the latest Single-Family Rent Index from CoreLogic, single-family rent saw the fastest year-over-year growth in over 16 years when comparing data for November each year (see graph below):
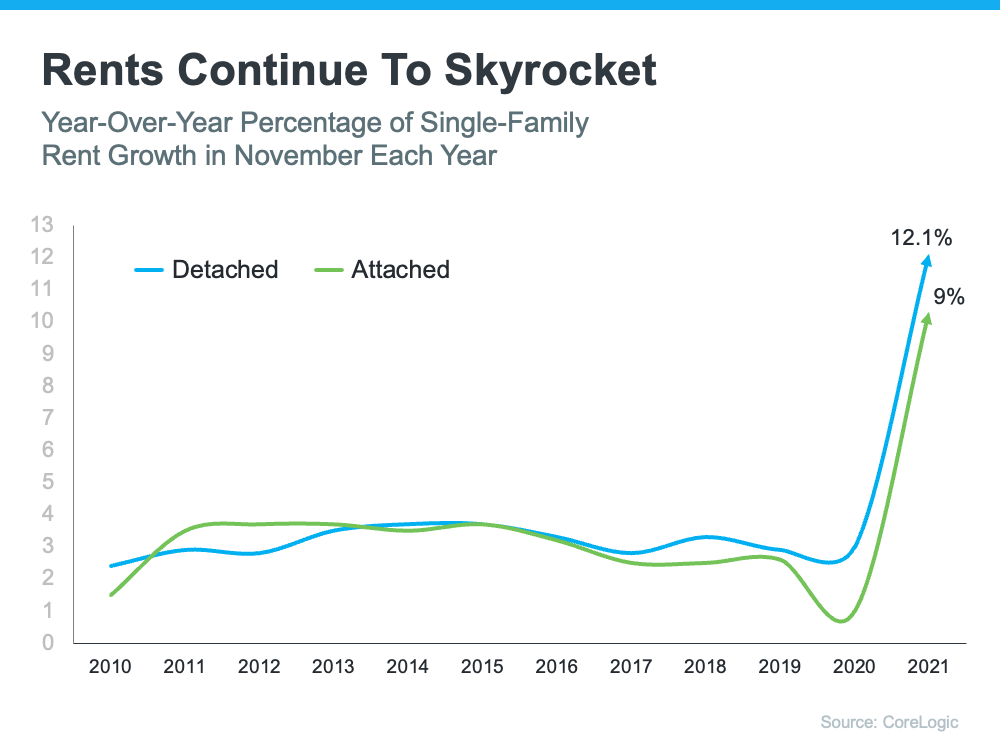
Molly Boesel, Principal Economist at CoreLogic, stresses the importance of what the data shows:
“Single-family rent growth hit its sixth consecutive record high. . . . Annual rent growth . . . was more than three times that of a year earlier. Rent growth should continue to be robust in the near term, especially as the labor market continues to improve.”
What Does This Mean for You?
While it’s true home prices and mortgage rates are rising, so are monthly rents. As a prospective buyer, rising rates and prices shouldn’t be enough to keep you on the sideline, though. As the chart above shows, rents are skyrocketing. The big difference is, when you rent, that rising cost benefits your landlord’s investment strategy, but it doesn’t deliver any sort of return for you.
In contrast, when you buy a home, your monthly mortgage payment serves as a form of forced savings. Over time, as you pay down your loan and as home values rise, you’re building equity (and by extension, your own net worth). Not to mention, you’ll lock in your mortgage payment for the duration of your loan (typically 15 to 30 years) and give yourself a stable and reliable monthly payment.
When asking yourself if you should keep renting or if it’s time to buy, think about what Todd Teta, Chief Product Officer at ATTOM Data, says:
“. . . Home ownership still remains the more affordable option for average workers in a majority of the country because it still takes up a smaller portion of their pay.”
If buying takes up a smaller portion of your pay and has benefits renting can’t provide, the question really becomes: is renting really worth it?
Bottom Line
If you’re weighing your options between renting and buying, it’s important to look at the full picture. While buying a home can feel like a daunting process, having a trusted advisor on your side is key. Let’s connect to explore your options so you can learn more about the benefits of homeownership today.