Real Estate Information Archive

Blog

Displaying blog entries 81-90 of 353

Market Trends Newsletter for Mt. Hood March 2019

by Liz Warren

header

Market Trends Mt. Hood Real Estate February 2019

Featured Listing

Featured Listing

For Sale: $499,950

More Information

Local Update for February Sales

Below are the latest stats for February with seventeen closed sales. The sales are spread throughout the market from Brightwood to Government Camp. Three condos and two forest service cabins closed. Single family properties were scooped up by many second home buyers and investment vacation rental buyers. The demand for vacation homes has skyrocke

Continue Reading...

National News For April

U.S. Real Estate Overview Note: February 2019 data below are the most recent released by the National Association of Realtors. Existing-home sales rebounded strongly in February, experiencing the largest month-over-month gain since December 2015, according to the National Association of Realtors®. Three of the four major U.S

Continue Reading...

New App for Buyers and Sellers!

If you are out and about looking for properties or just want to keep up with the market, this new APP has everything you'll need in the process. Download the New Keller Williams App to Keep You In the Know for Properties On Mt. Hood

Continue Reading...

Now is a Great Time to Sell on Mt. Hood

by Liz Warren

2 Reports That Say Now Is a Great Time to Sell

2 Reports That Say Now Is a Great Time to Sell | MyKCM
 

Heading into the spring buying market, there are strong trends starting to emerge.

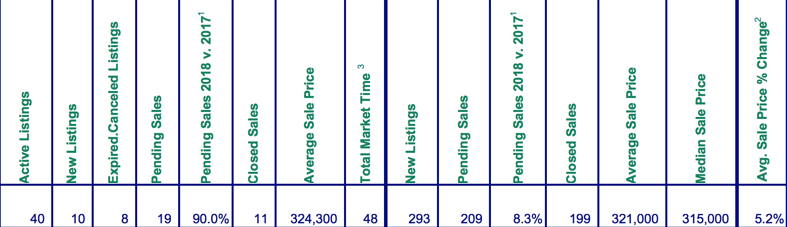
The Mt. Hood area has about a 2.4 month supply of homes for our area listed as area 153 in RMLS. This includes properties in Government Camp, Welches, Rhododendron, Brightwood and a few falling in the Sandy zip code. This is a complete seller's market!

The inventory of homes for sale has increased on a year-over-year basis for eight months in a row. Home price appreciation has continued to grow, although at a slower rate. The homeownership rate has reached heights last seen in 2014, with millennials and Generation X leading the way!

Let’s dive a little deeper into some of the recent reports that have been released and what they mean for the spring buying season!

1. National Association of Realtor’s Existing Home Sales Report              

Sales of existing homes were down for the third consecutive month in January. Some of this can be explained by the natural seasonality that the real estate market experiences every year, and some can be explained even further by a lack of homes available for sale on the market.

Inventory

For the last eight months, the inventory of homes for sale has been higher when compared to the same month the year before. The challenge in the market is the mismatch of the type of home that is available for sale. First-time homebuyers looking for a starter home are often competing with other buyers to stand out, often outbidding each other.

Lawrence Yun, NAR’s Chief Economist, agrees that the market is still experiencing an inventory shortage.

“In particular, the lower end of the market is experiencing a greater shortage, and more home construction is needed.”
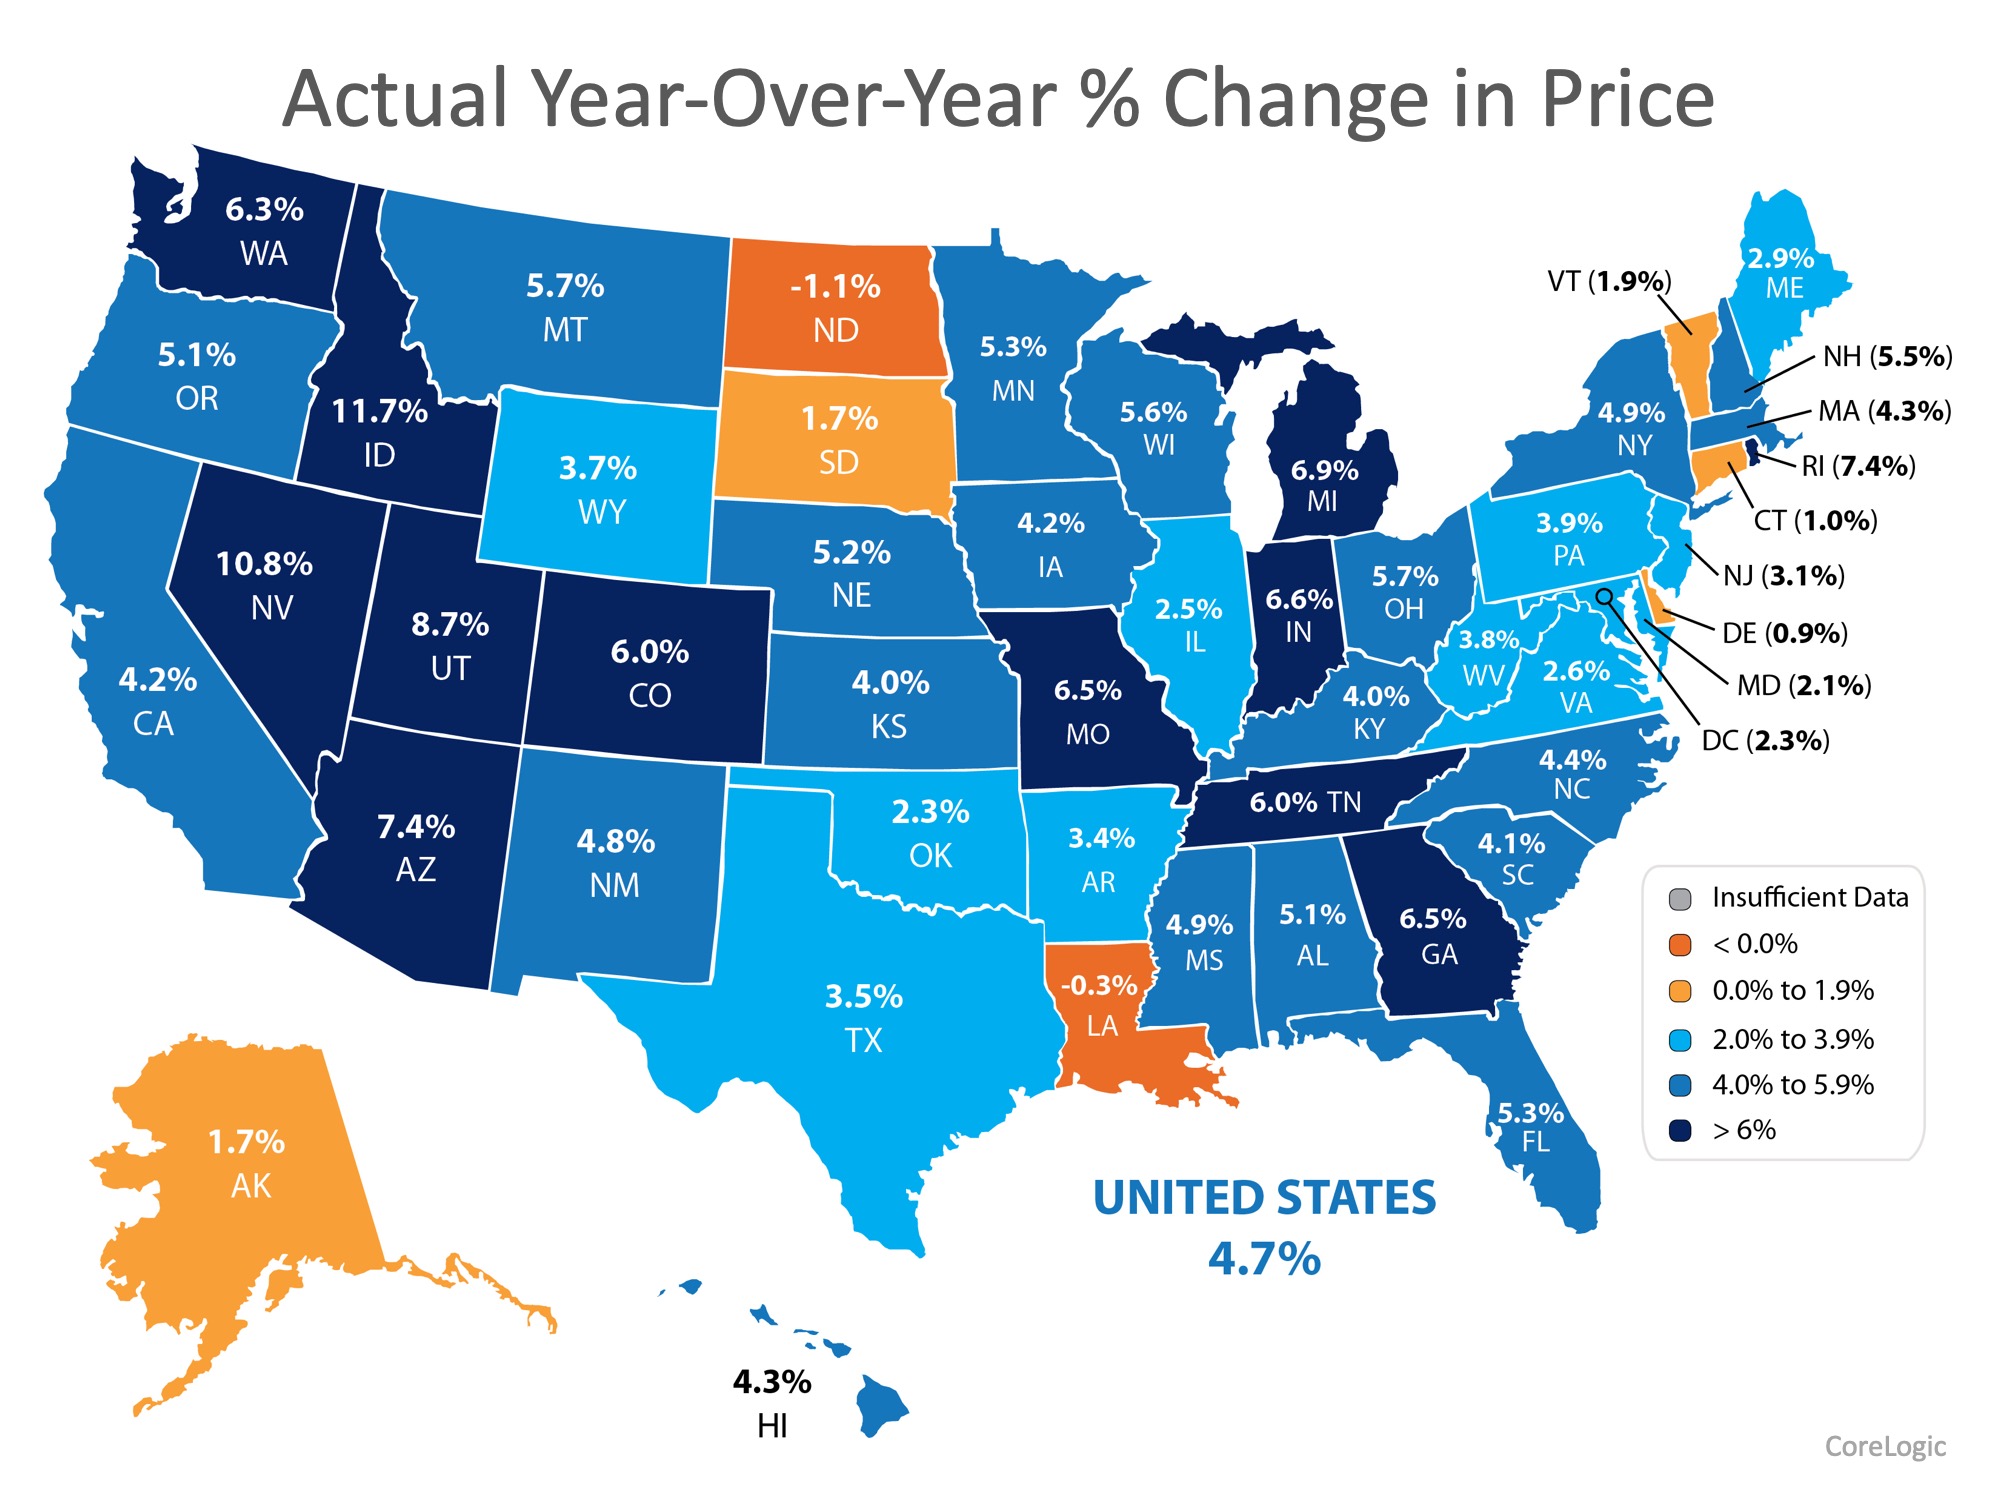
Home Prices

The median home price for homes sold in January was $247,500. This is up 2.8% from January 2018 and marks the 83rd consecutive month of year-over-year gains. The 2.8% growth in home prices represents the smallest year-over-year change since February 2012 but is a welcome change for buyers who had feared being priced out of the market.

Days on the Market

Properties that sold in January were on the market for an average of 49 days with 38% of homes on the market for less than a month.

Yun is positive about how today’s market conditions will help buyers this spring,

 “Existing home sales in January were weak compared to historical norms; however, they are likely to have reached a cyclical low. Moderating home prices combined with gains in household income will boost housing affordability, bringing more buyers to the market in the coming months.”

2. NAR’s    Pending Home Sales Report                          

The national Pending Home Sales Index (PHSI) rose 4.6% to 103.2 in January from 98.7 in December. An index score of 100 is considered normal. All four major regions of the country experienced gains in January, with the largest increase coming in the South.

 “The PHSI is a leading indicator for the housing sector, based on pending sales of existing homes. A sale is listed as pending when the contract has been signed but the transaction has not closed, though the sale usually is finalized within one or two months of signing.”

Increases in the PHSI often predict increases in the level of home sales in the coming months, which is great news for the housing market leading in to spring! Yun had this to say,

“Homebuyers are now returning and taking advantage of lower interest rates, while a boost in inventory is also providing more choices for consumers.”

Bottom Line

The housing market in 2019 will require homeowners to list their house at the right price to attract buyers. If interest rates continue to stay low while wages increase, and more inventory comes to market, 2019 could be one of the best years for home sales in recent history.

Mt. Hood Condo Sales for 2018

by Liz Warren

Mt. Hood Condos have been selling like hotcakes in 2018. Thirty two condos sold last year with twenty of those sales in Government Camp. Here’s the breakdown for each Condo complex:


                                               Government Camp Condos


  • Collins Lake            11
  • Grand Lodges           3                   
  • Snow Bird                  2
  • Edelweiss                  1
  • Thunderhead             1


Meanwhile down the hill in Welches twelve condos changed hands. Here’s the shake down of those twelve sales by complex:


  • Fairway Estates          7     
  • Clear Hills                    3
  • Whispering Woods     2


Demand is high for condos in Government Camp and Welches!


Check out current inventory for sale in Government Camp


No condos currently available in Welches.


Give me a call if I can help you with selling or buying your Mt. Hood Condo!

Possible Year Over Year Price Change

by Liz Warren

If your plan for 2019 includes selling your home, you will want to pay attention to where experts believe home values are headed. According to the latest Home Price Index from CoreLogic, home prices increased by 4.7% over the course of 2018.

The map below shows the results of the latest index by state. Oregon is right up there with a 5.1 increase in 2018!

How To List Your Home for the Best Price | Simplifying The Market

Real estate is local. Each state appreciates at different levels. The majority of the country saw at least a 2.0% gain in home values, while some residents in North Dakota and Louisiana may have felt prices slow slightly.

This effect will be short lived. In the same report, CoreLogic forecasts that every state in the Union will experience at least 2.0% appreciation, with the majority of the country gaining at least 4.0%! The prediction for the country comes in at 4.6%. For a median-priced home, that translates to over $14,000 in additional equity next year! (The map below shows the forecast by state.)

How To List Your Home for the Best Price | Simplifying The Market

So, how does this help you list your home for the best price?

Armed with the knowledge of how much experts believe your house will appreciate this year, you will be able to set an appropriate price for your listing from the start. If homes like yours are appreciating at 4.0%, you won’t want to list your home for more than that amount!

One of the biggest mistakes homeowners make is pricing their homes too high and reducing the price later when they do not get any offers. This can lead buyers to believe that there may be something wrong with the home, when in fact the price was just too high for the market.

Bottom Line

Pricing your home right from the start is one of the most challenging parts of selling your home. Once you decide to list your house, let’s get together to discuss where home values are headed in your area!


Mt. Hood Pricing for 2019

by Liz Warren


Based on recent activities and a lack of inventory, the Mt. Hood area will likely continue to appreciate in the coming year, we just don't have any idea how much that appreciation will be.      Many properties new to the market right now sell within days! This bodes well for a good 2019!


This information has just been released by RMLS, multiple listing service, for sales in December for our Mt. Hood area. A slow down in closed sales is reflected by the minimal number of closed transactions this past month reaching eleven closed sales. No surprise considering the lack of inventory on the market. There are currently 43 properties for sale and 60% of those are more than $300,000. If there ever was a good time to sell on the mountain it is right now with very little competition!


Mt. Hood Real estate sales for December 2018

MMt. Hood Mortgage Rates Over the Next Year

by Liz Warren

Happy New Year

by Liz Warren


Here’s to a Wonderful 2019!

Here’s to a Wonderful 2019! | MyKCM
 

We hope 2019 is a great year for you, both personally and professionally!

Liz Warren

Five Reasons To Use A Real Estate Professional on Mt. Hood

by Liz Warren

Home Equity

by Liz Warren

Displaying blog entries 81-90 of 353

Syndication

Categories

Archives