Join the Mt. Hood Community and Buy This Fall
Displaying blog entries 391-400 of 1910
![What’s Causing Today’s Competitive Real Estate Market? [INFOGRAPHIC] | MyKCM](https://files.mykcm.com/2021/10/07124832/20211008-MEM-1046x2072.png)
![It’s Still a Sellers’ Market [INFOGRAPHIC] | MyKCM](https://files.mykcm.com/2021/09/22165444/20210924-MEM-1046x2173.png)
Looking for a fantastic getaway on the mountain? Check out this Shadow Hawk Condo with views of the Salmon River. Upper level one bedroom unit comes mostly furnished. Plenty of storage for your Mt. Hood toys. Full time manager onsite. Pool for summer time and sauna in clubhouse. HOA is $425 per month. Twenty seven hole golf course across the street at the Mt. Hood Oregon Resort. $269500.
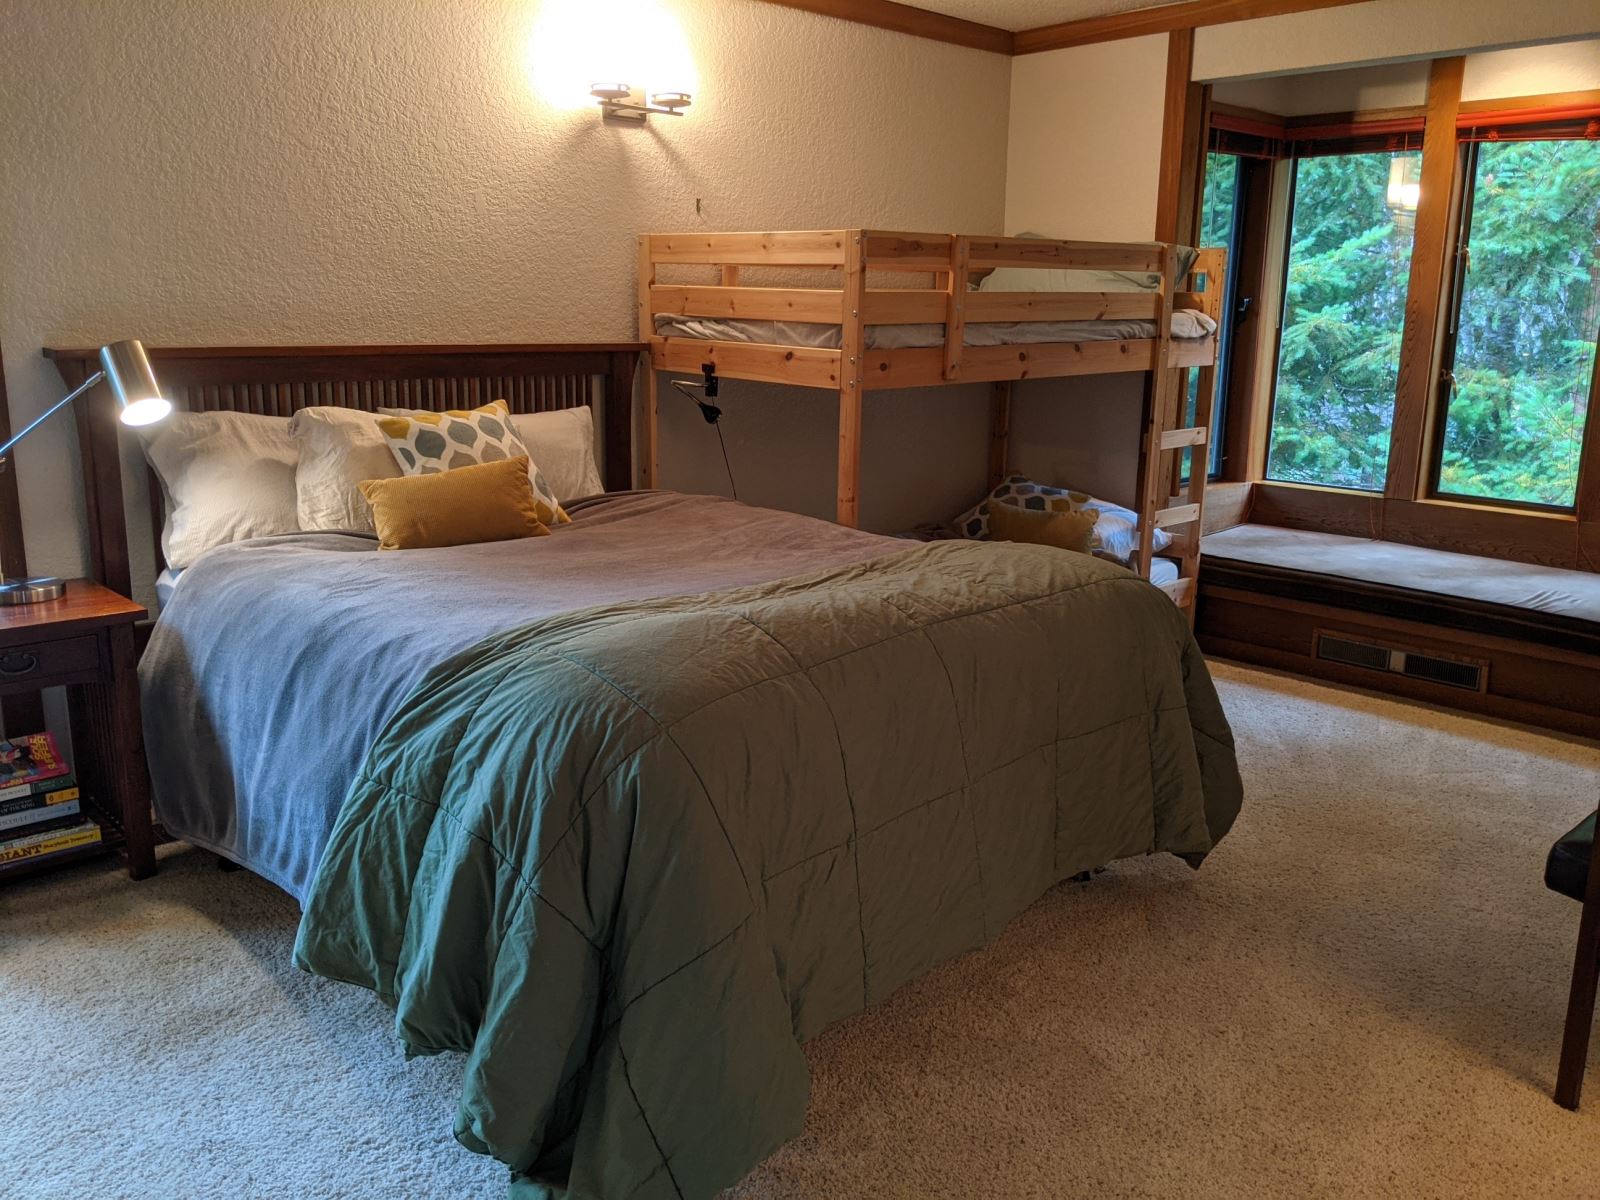


If you’ve been in your home for longer than five years, you’re not alone. According to recent data from First American, homeowners are staying put much longer than historical averages (see graph below):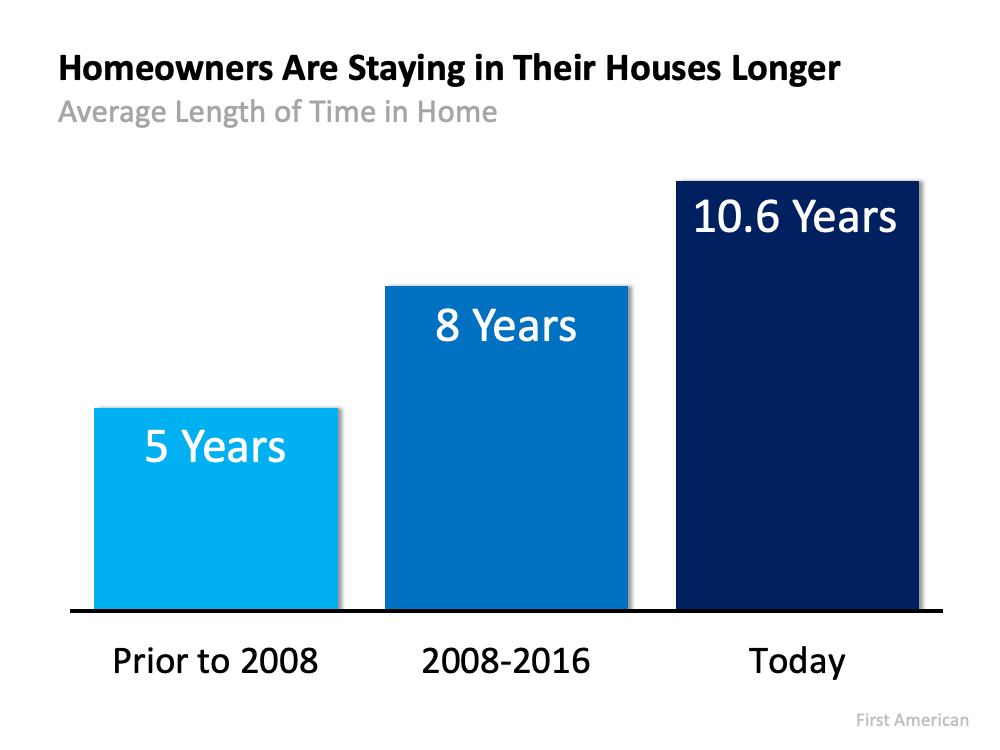 As the graph shows, before 2008, homeowners sold their houses after an average of just five years. Today, that number has more than doubled to over 10 years. The housing industry refers to this as your tenure.
To really explore tenure, it’s important to understand what drives people to make a move. An article from The Balance explores some of the primary reasons individuals choose to sell their houses. It says:
“People who move for home-related reasons might need a larger home or a house that better fits their needs, . . . Financial reasons for moving include wanting a nicer home, moving to a newer home to avoid making repairs on the old one, or cashing in on existing equity.”
If you’ve been in your home for longer than the norm, chances are you’re putting off addressing one, if not several, of the reasons other individuals choose to move. If this sounds like you, here are a few things to consider:
As the past year has shown, our needs can change rapidly. That means the longer you’ve been in your home, the more likely it is your needs have evolved. The Balance notes several personal factors that could lead to your home no longer meeting your needs, including relationship and job changes.
For example, many workers recently found out they’ll be working remotely indefinitely. If that’s the case for you, you may need more space for a dedicated home office. Other homeowners choose to sell because the number of people living under their roof changes. Now more than ever, we’re spending more and more time at home. As you do, consider if your home really delivers on what you need moving forward.
One of the biggest benefits of homeownership is the equity your home builds over time. If you’ve been in your house for several years, you may not realize how much equity you have. According to the latest Homeowner Equity Report from CoreLogic, homeowners gained an average of $33,400 in equity over the past year.
That equity, plus today’s low mortgage rates, can fuel a major upgrade when you sell your home and purchase a new one. Or, if you’re looking to downsize, your equity can help provide a larger down payment and lower your monthly payments over the life of your next loan. No matter what, there are significant financial benefits to selling in today’s market.
If you’ve been in your home for 5-10 years or more, now might be the time to explore your options. Today’s low rates and your built-up equity could provide you with the opportunity to address your evolving needs. If you feel it’s time to sell, let’s connect.
![Have You Ever Seen a Housing Market Like This? [INFOGRAPHIC] | MyKCM](https://files.mykcm.com/2021/09/16133349/20210917-MEM-1046x2047.png)
An important metric in today’s residential real estate market is the number of homes available for sale. The shortage of available housing inventory is the major reason for the double-digit price appreciation we’ve seen in each of the last two years. It’s the reason many would-be purchasers are frustrated with the bidding wars over the homes that are available. However, signs of relief are finally appearing.
According to data from realtor.com, active listings have increased over the last four months. They define active listings as:
“The active listing count tracks the number of for sale properties on the market, excluding pending listings where a pending status is available. This is a snapshot measure of how many active listings can be expected on any given day of the specified month.”
Historically, housing inventory increases throughout the summer months, starts to tail off in the fall, and then drops significantly over the winter. The graph below shows this trend along with the month active listings peaked in 2017, 2018, and 2019.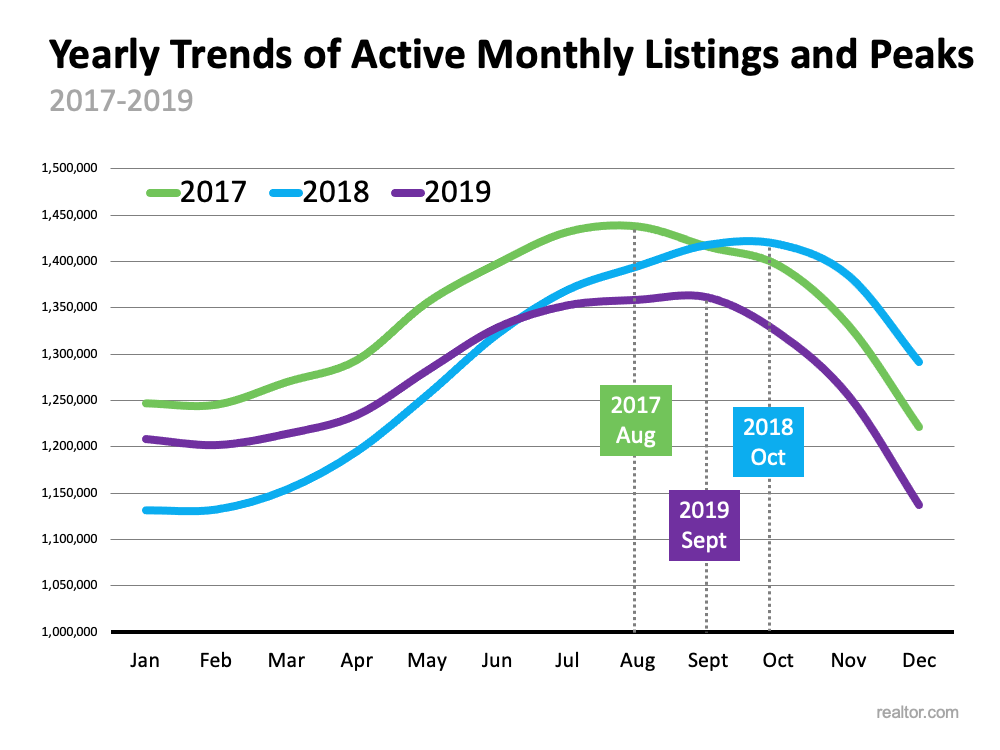
Last year, the trend was different. Historical seasonality wasn’t repeated in 2020 since many homeowners held off on putting their houses up for sale because of the pandemic (see graph below). In 2020, active listings peaked in April, and then fell off dramatically for the remainder of the year.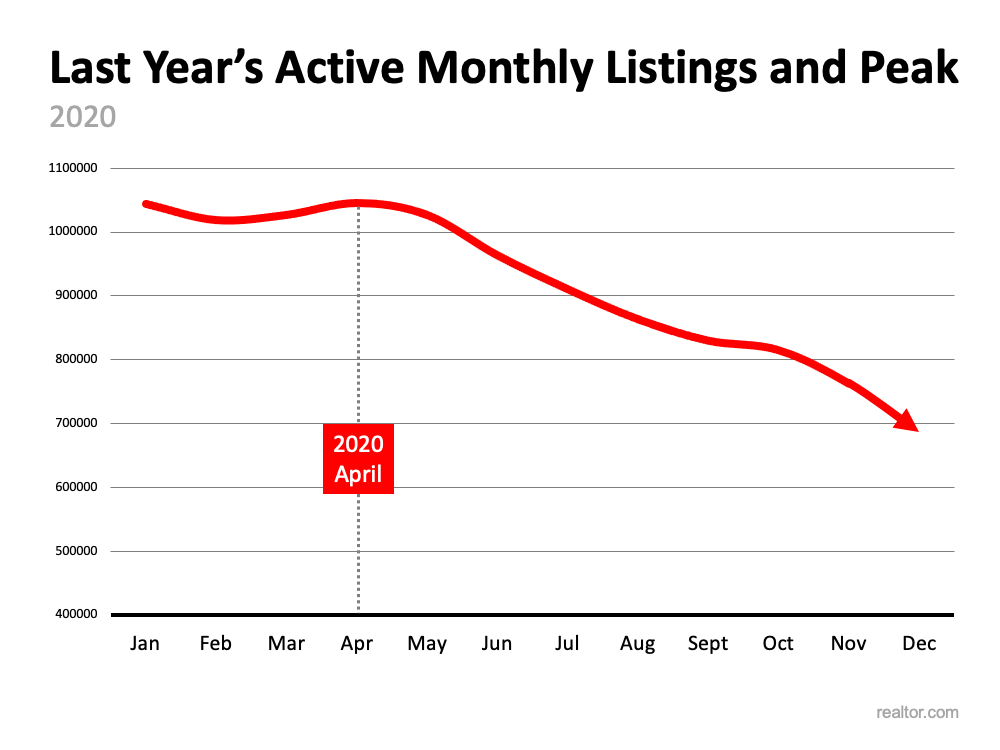
Due to the decline of active listings in 2020, 2021 began with record-low housing inventory counts. However, we’ve been building inventory over the last several months as more listings come to the market (see graph below):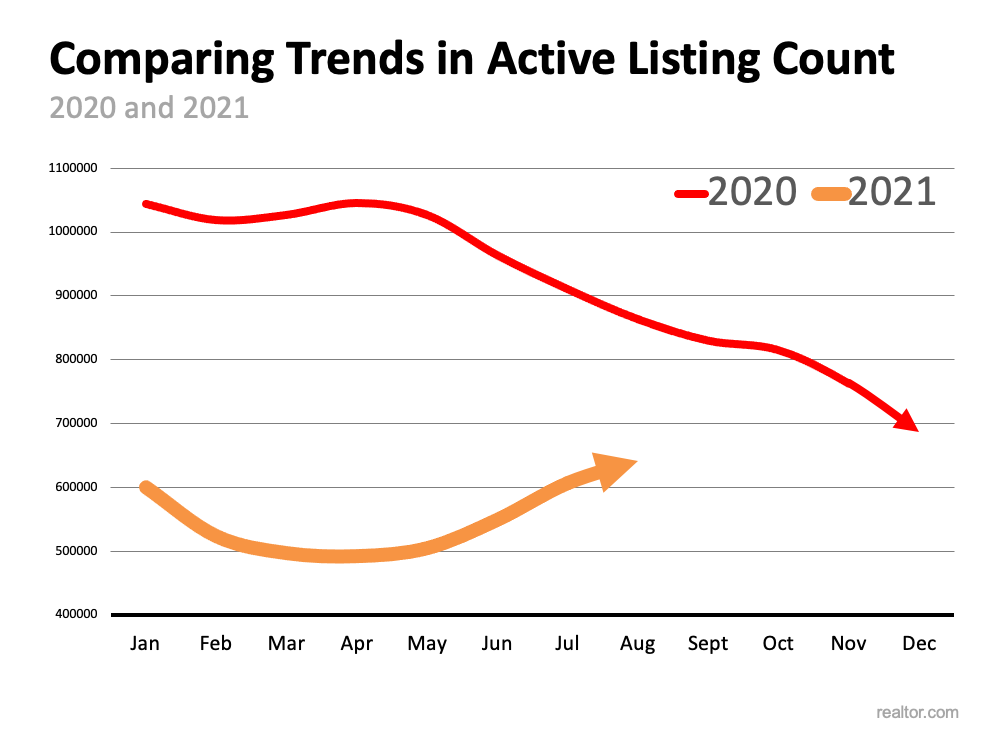 There are three main reasons we may see listings continue to increase throughout this fall and into the winter.
The Mt. Hood real estate market is seeing a small increase in inventory. We are currently up to 15 units on the market. Only six of those properties are under $400,000. Affordability is an issue with demand staying high.
If you’re in the market to buy a home, stick with it. There are new listings becoming available every day. If you’re thinking of selling your house, you may want to list your home before this additional competition comes to market.
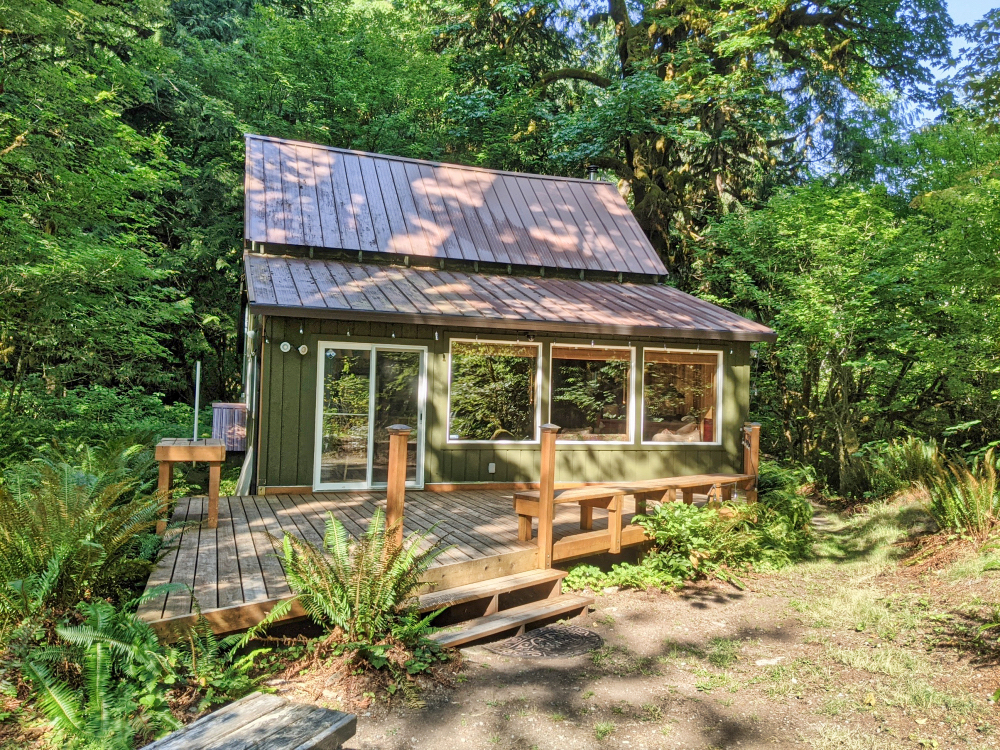
Looking for a great getaway? This is it. This is a well maintained charmer with two bedrooms upstairs. A wonderful open floor plan features living room, kitchen and dining are all open to each other including windows galore letting in natural light. Wood stove will warm your toes after a day on the slopes. Large deck off of the dining room area for summer barbeques. Just steps to Still Creek which is one of the most popular creeks on the mountain. Dog and kid friendly Still Creek is great for summer wading and swimming. The cabin is located in the Mt. Hood National Forest. $350,000
.jpeg)

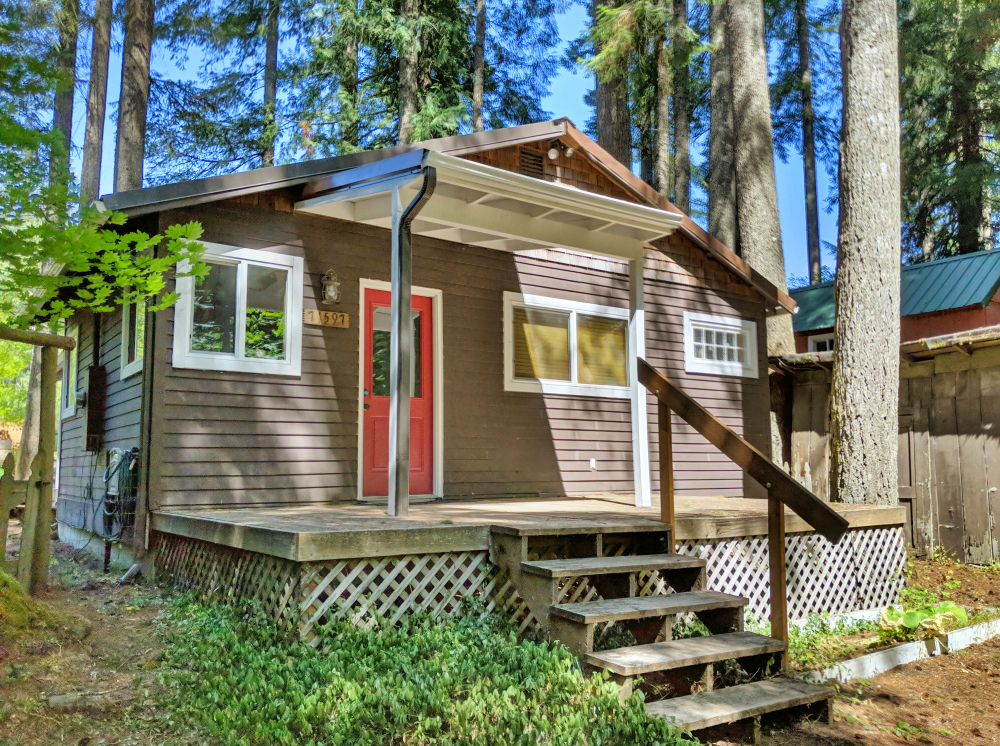
Enjoy your 1935 mountain getaway near all Mt. Hood activities. One bedroom and mini sleeping loft. Everything you need with wood walls, lots of ambiance, vaulted ceilings, paned windows, decks and a fenced yard! Cozy wood stove to warm up your toes, two covered porches, outbuilding and wood shed. There's even a utility room for washer and dryer. Jetted tub in the bathroom. Only one hour to Portland! Mt. Hood National Forest just down the street and about 20 minutes to the slopes. $295,000
Displaying blog entries 391-400 of 1910

