Three Graphs Showing This Isn't a Housing Bubble
3 Graphs To Show This Isn’t a Housing Bubble

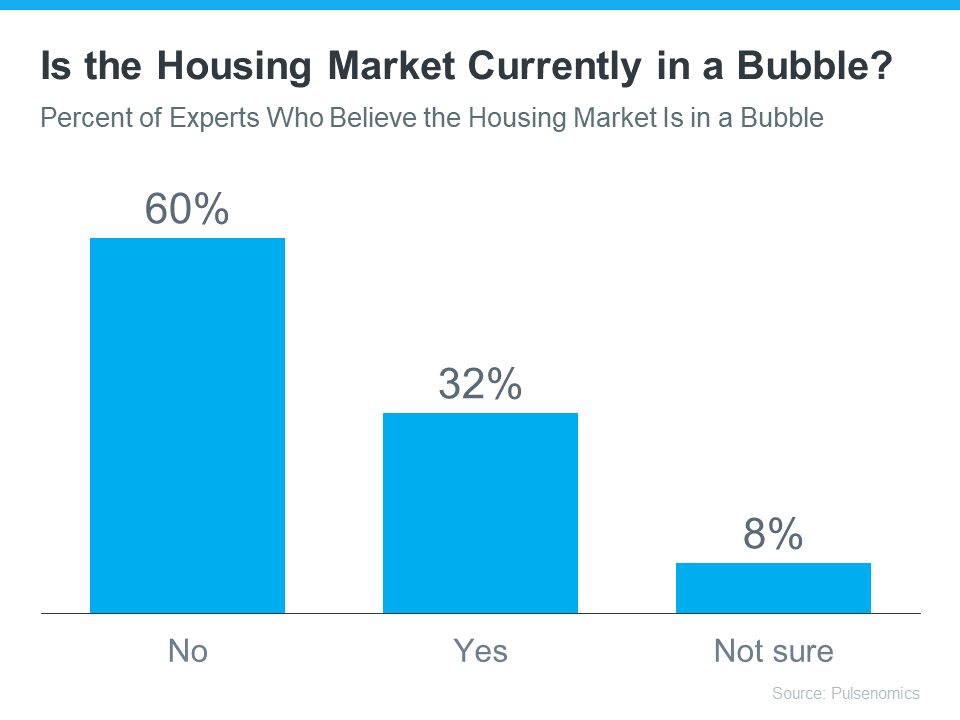
With all the headlines and buzz in the media, some consumers believe the market is in a housing bubble. As the housing market shifts, you may be wondering what’ll happen next. It’s only natural for concerns to creep in that it could be a repeat of what took place in 2008. The good news is, there’s concrete data to show why this is nothing like the last time.
There’s a Shortage of Homes on the Market Today, Not a Surplus
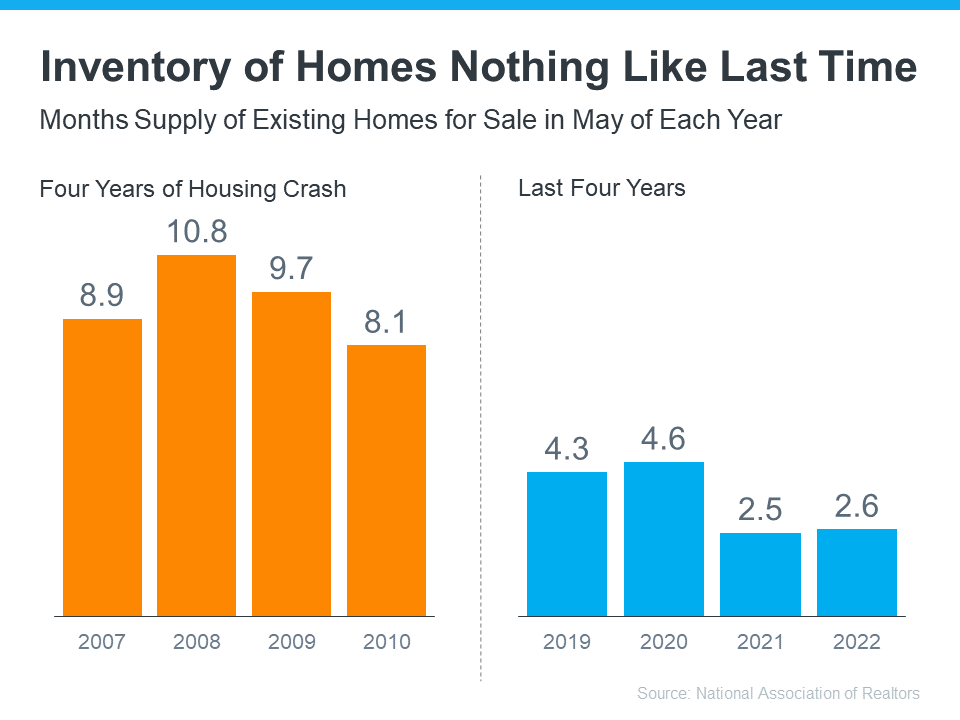
The supply of inventory needed to sustain a normal real estate market is approximately six months. Anything more than that is an overabundance and will causes prices to depreciate. Anything less than that is a shortage and will lead to continued price appreciation.
For historical context, there were too many homes for sale during the housing crisis (many of which were short sales and foreclosures), and that caused prices to tumble. Today, supply is growing, but there’s still a shortage of inventory available.
The graph below uses data from the National Association of Realtors (NAR) to show how this time compares to the crash. Today, unsold inventory sits at just a 3.0-months’ supply at the current sales pace.
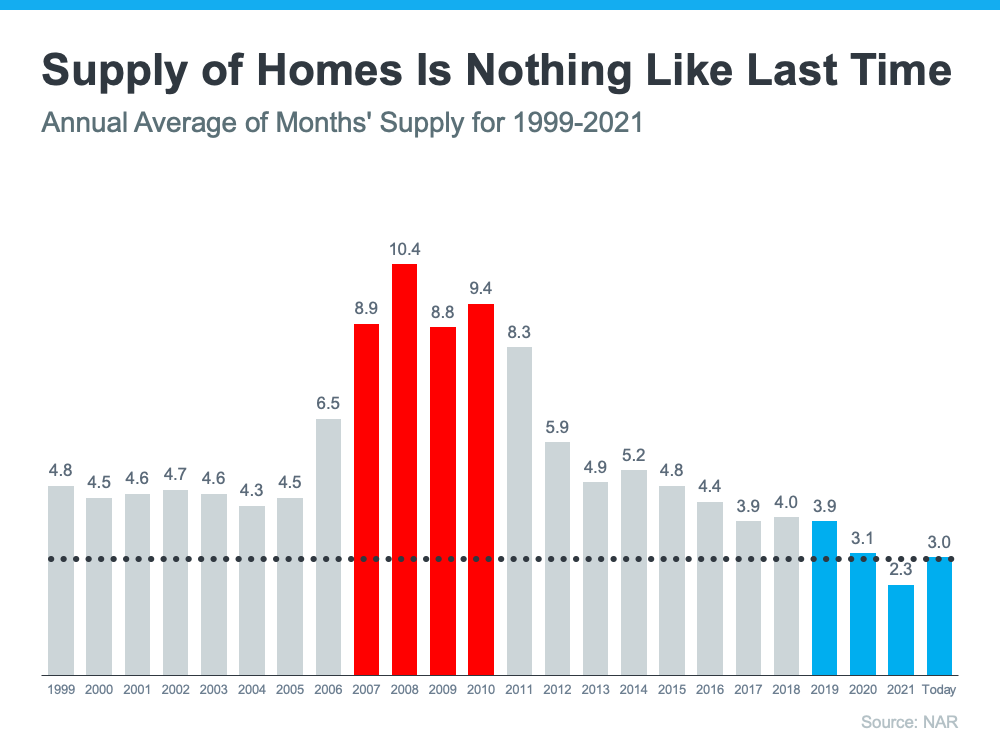
One of the reasons inventory is still low is because of sustained underbuilding. When you couple that with ongoing buyer demand as millennials age into their peak homebuying years, it continues to put upward pressure on home prices. That limited supply compared to buyer demand is why experts forecast home prices won’t fall this time.
Mortgage Standards Were Much More Relaxed During the Crash
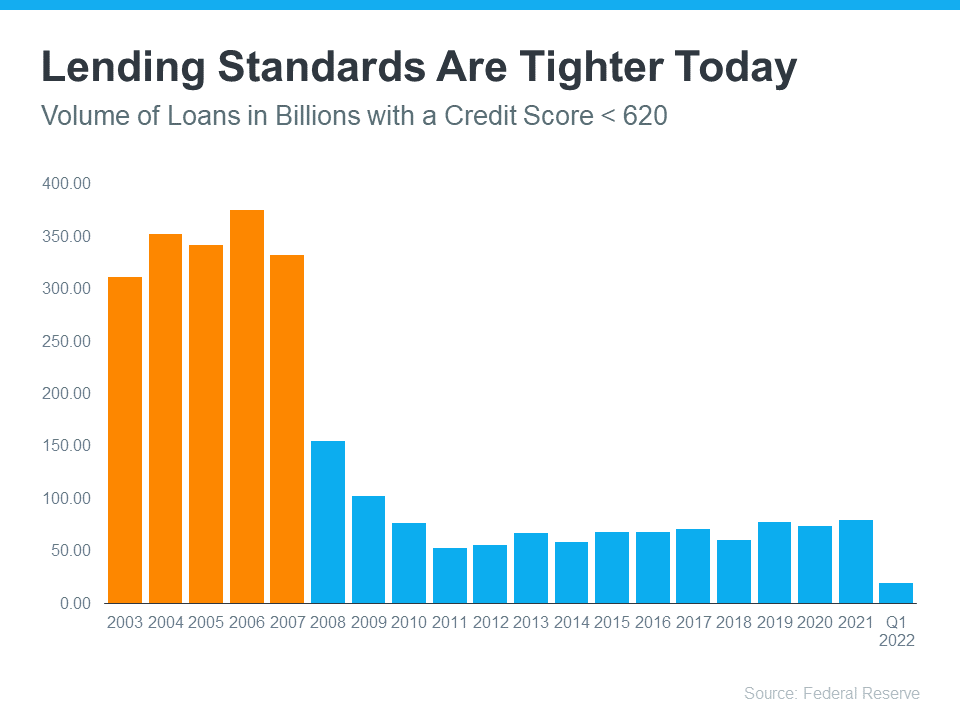
During the lead-up to the housing crisis, it was much easier to get a home loan than it is today. The graph below showcases data on the Mortgage Credit Availability Index (MCAI) from the Mortgage Bankers Association (MBA). The higher the number, the easier it is to get a mortgage.
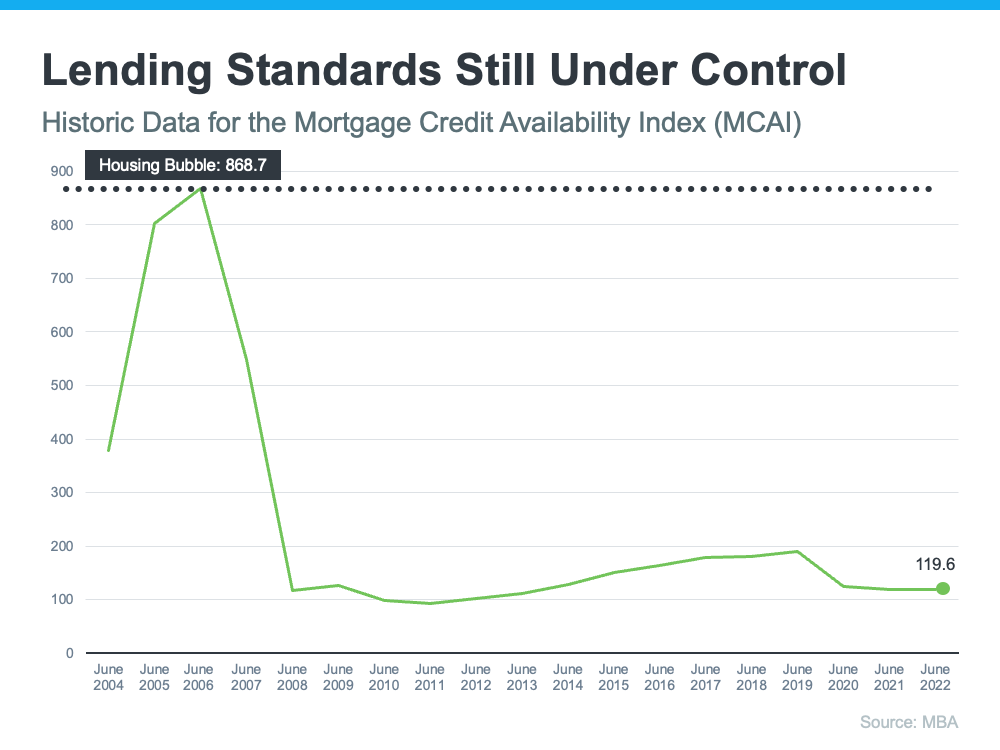
Running up to 2006, banks were creating artificial demand by lowering lending standards and making it easy for just about anyone to qualify for a home loan or refinance their current home. Back then, lending institutions took on much greater risk in both the person and the mortgage products offered. That led to mass defaults, foreclosures, and falling prices.
Today, things are different, and purchasers face much higher standards from mortgage companies. Mark Fleming, Chief Economist at First American, says:
“Credit standards tightened in recent months due to increasing economic uncertainty and monetary policy tightening.”
Stricter standards, like there are today, help prevent a risk of a rash of foreclosures like there was last time.
The Foreclosure Volume Is Nothing Like It Was During the Crash
The most obvious difference is the number of homeowners that were facing foreclosure after the housing bubble burst. Foreclosure activity has been on the way down since the crash because buyers today are more qualified and less likely to default on their loans. The graph below uses data from ATTOM Data Solutions to help tell the story:
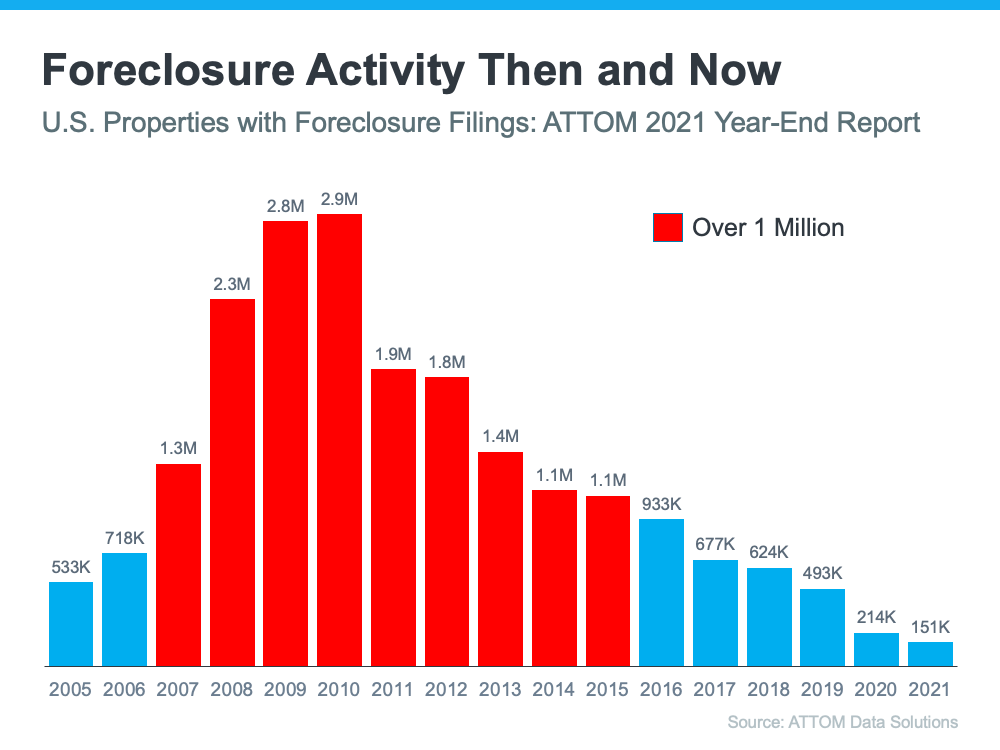
In addition, homeowners today are equity rich, not tapped out. In the run-up to the housing bubble, some homeowners were using their homes as personal ATMs. Many immediately withdrew their equity once it built up. When home values began to fall, some homeowners found themselves in a negative equity situation where the amount they owed on their mortgage was greater than the value of their home. Some of those households decided to walk away from their homes, and that led to a wave of distressed property listings (foreclosures and short sales), which sold at considerable discounts that lowered the value of other homes in the area.
Today, prices have risen nicely over the last few years, and that’s given homeowners an equity boost. According to Black Knight:
“In total, mortgage holders gained $2.8 trillion in tappable equity over the past 12 months – a 34% increase that equates to more than $207,000 in equity available per borrower. . . .”
With the average home equity now standing at $207,000, homeowners are in a completely different position this time.
Bottom Line
If you’re worried we’re making the same mistakes that led to the housing crash, the graphs above should help alleviate your concerns. Concrete data and expert insights clearly show why this is nothing like the last time.

![Three Reasons To Buy a Home in Today’s Shifting Market [INFOGRAPHIC] | MyKCM](https://files.mykcm.com/2022/07/28132341/20220729-MEM-1046x1709.png)

![Great News About Housing Inventory [INFOGRAPHIC] | MyKCM](https://files.mykcm.com/2022/07/21111905/20220722-MEM-1046x2035.jpg)
![Why Growing Home Equity Is Great News if You Plan To Move [INFOGRAPHIC] | MyKCM](https://files.mykcm.com/2022/07/07152642/20220708-MEM-1046x1851.png)