Real Estate Information Archive

Blog

Displaying blog entries 211-220 of 1881

Graphs Showing Today's Housing Market Vs. 2008

by Liz Warren

3 Graphs Showing Why Today’s Housing Market Isn’t Like 2008

3 Graphs Showing Why Today’s Housing Market Isn’t Like 2008 | MyKCM
 

With all the headlines and talk in the media about the shift in the housing market, you might be thinking this is a housing bubble. It’s only natural for those thoughts to creep in that make you think it could be a repeat of what took place in 2008. But the good news is, there’s concrete data to show why this is nothing like the last time.

There’s Still a Shortage of Homes on the Market Today, Not a Surplus

For historical context, there were too many homes for sale during the housing crisis (many of which were short sales and foreclosures), and that caused prices to fall dramatically. Supply has increased since the start of this year, but there’s still a shortage of inventory available overall, primarily due to almost 15 years of underbuilding homes.

The graph below uses data from the National Association of Realtors (NAR) to show how the months’ supply of homes available now compares to the crash. Today, unsold inventory sits at just a 3.2-months’ supply at the current sales pace, which is significantly lower than the last time. There just isn’t enough inventory on the market for home prices to come crashing down like they did last time, even though some overheated markets may experience slight declines.

3 Graphs Showing Why Today’s Housing Market Isn’t Like 2008 | MyKCM

Mortgage Standards Were Much More Relaxed Back Then

During the lead-up to the housing crisis, it was much easier to get a home loan than it is today. Running up to 2006, banks were creating artificial demand by lowering lending standards and making it easy for just about anyone to qualify for a home loan or refinance their current home.

Back then, lending institutions took on much greater risk in both the person and the mortgage products offered. That led to mass defaults, foreclosures, and falling prices. Today, things are different, and purchasers face much higher standards from mortgage companies.

The graph below uses Mortgage Credit Availability Index (MCAI) data from the Mortgage Bankers Association (MBA) to help tell this story. In that index, the higher the number, the easier it is to get a mortgage. The lower the number, the harder it is. In the latest report, the index fell by 5.4%, indicating standards are tightening.

3 Graphs Showing Why Today’s Housing Market Isn’t Like 2008 | MyKCM

This graph also shows just how different things are today compared to the spike in credit availability leading up to the crash. Tighter lending standards over the past 14 years have helped prevent a scenario that would lead to a wave of foreclosures like the last time.

The Foreclosure Volume Is Nothing Like It Was During the Crash

Another difference is the number of homeowners that were facing foreclosure after the housing bubble burst. Foreclosure activity has been lower since the crash, largely because buyers today are more qualified and less likely to default on their loans. The graph below uses data from ATTOM Data Solutions to help paint the picture of how different things are this time:

3 Graphs Showing Why Today’s Housing Market Isn’t Like 2008 | MyKCM

Not to mention, homeowners today have options they just didn’t have in the housing crisis when so many people owed more on their mortgages than their homes were worth. Today, many homeowners are equity rich. That equity comes, in large part, from the way home prices have appreciated over time. According to CoreLogic:

“The total average equity per borrower has now reached almost $300,000, the highest in the data series.”

Rick Sharga, Executive VP of Market Intelligence at ATTOM Dataexplains the impact this has:

“Very few of the properties entering the foreclosure process have reverted to the lender at the end of the foreclosure. . . . We believe that this may be an indication that borrowers are leveraging their equity and selling their homes rather than risking the loss of their equity in a foreclosure auction.”

 This goes to show homeowners are in a completely different position this time. For those facing challenges today, many have the option to use their equity to sell their house and avoid the foreclosure process.

Bottom Line

If you’re concerned we’re making the same mistakes that led to the housing crash, the graphs above should help alleviate your fears. Concrete data and expert insights clearly show why this is nothing like the last time.

Mt. Hood Waterfront Custom Home on Nearly Two Acres

by Liz Warren

Hit the Brakes! Rapid River Retreat on the Sandy River is one of Mt. Hood's best vacation rentals for over ten years. Nearly two acres of waterfront with three bedroom, two bath home. Soaring ceilings and natural light. Great room with gourmet kitchen, granite counter tops and wet bar. Cozy wood stove insert to warm your toes after a day on the slopes or hiking in the Mt. Hood National Forest up the street. Hop out to the covered hot tub overlooking the river. Secluded location on private gated road. Turn key! Perfect full time or second home too, 1 hour to PDX!!

$949,000

Sandy Riverfront Custom Home on Nearly Two acres on Mt. Hood

Mt. Hood Sandy Waterfront Custom Home on Nearly Two Acres          Great Room of Mt. Hood Vacation Rental for sale

Mt. Hood Dining Room on the Sandy River          Sandy River on Mt. Hood

                                  Dining Room in Mt. Hood Vacation Rental for sale


Perspective Matters When Selling Your Home or Cabin on Mt. Hood

by Liz Warren


Does the latest news about the housing market have you questioning your plans to sell your house? If so, perspective is key. Here are some of the ways a trusted real estate professional can explain the shift that’s happening today and why it’s still a sellers’ market even during the cooldown.

Fewer Homes for Sale than Pre-Pandemic

While the supply of homes available for sale has increased this year compared to last, we’re still nowhere near what’s considered a balanced market. A recent article from Calculated Risk helps put this year’s increased inventory into context (see graph below):

Perspective Matters When Selling Your House Today | MyKCM

It shows supply this year has surpassed 2021 levels by over 30%. But the further back you look, the more you’ll understand the big picture. Compared to 2020, we’re just barely above the level of inventory we saw then. And if you go all the way back to 2019, the last normal year in real estate, we’re roughly 40% below the housing supply we had at that time.

Why does this matter to you? When inventory is low, there is still demand for your house because there just aren’t enough homes available for sale.

Homes Are Still Selling Faster Than More Normal Years

And while homes aren’t selling as quickly as they did a few months ago, the average number of days on the market is still well below pre-pandemic norms – in large part because inventory is so low. The graph below uses data from the Realtors’ Confidence Index by the National Association of Realtors (NAR) to illustrate this trend:

Perspective Matters When Selling Your House Today | MyKCM

As the graph shows, the pre-pandemic numbers (shown in blue) are higher than the numbers we saw during the pandemic (shown in green). That’s because the average days on the market started to decrease as homes sold at record pace during the pandemic. Most recently, due to the cooldown in the housing market, the average days on the market have started to tick back up slightly (shown in orange) but are still far below the pre-pandemic norm.

What does this mean for you? While it may not be as fast as it was a couple of months ago, homes are still selling much faster than they did in more normal, pre-pandemic years. And if you price it right, your home could still go under contract quickly.

Buyer Demand Has Moderated and Is Now in Line with More Typical Years

Buyer demand has softened this year in response to rising mortgage rates. But again, perspective is key. Getting 3-5 offers like sellers did during the pandemic isn’t the norm. The graph below uses data from NAR going back to 2018 to help tell the story of this shift over time (see graph below):

Perspective Matters When Selling Your House Today | MyKCM

Prior to the pandemic, it was typical for homes sold to see roughly 2-2.5 offers (shown in blue). As the market heated up during the pandemic, the average number of offers skyrocketed as record-low mortgage rates drove up demand (shown in green). But most recently, the number of offers on homes sold today (shown in orange) has started to return to pre-pandemic levels as the market cools from the frenzy.

What’s the takeaway for you? Buyer demand has moderated from the pandemic peak, but it hasn’t disappeared. The buyers are still out there, and if you price your house at current market value, you’ll still be able sell your house today.

Bottom Line

If you have questions about selling your house in today’s housing market, let’s connect. That way you have context around what’s happening now, so you’re up to date on what you can expect when you’re ready to move.

Mt. Hood Buyers Increasing Choices and Negotiating Power

by Liz Warren


Mt. Hood Real Estate Market This Fall

by Liz Warren

What Are Experts Saying About the Fall Housing Market on Mt. Hood?

What Are Experts Saying About the Fall Housing Market? | MyKCM
 

The housing market is rapidly changing from the peak frenzy it saw over the past two years. That means you probably have questions about what your best move is if you’re thinking of buying or selling this fall.

To help you make a confident decision, lean on the professionals for insights. Here are a few things experts are saying about the fall housing market.

Expert Quotes for Fall Homebuyers

A recent article from realtor.com:

This fall, a more moderate pace of home selling, more listings to choose from, and softening price growth will provide some breathing room for buyers searching for a home during what is typically the best time to buy a home.”

Michael Lane, VP and General Manager, ShowingTime:

Buyers will continue to see less competition for homes and have more time to tour homes they like and consider their options.” 

Expert Quotes for Fall Sellers

Selma Hepp, Interim Lead of the Office of the Chief Economist, CoreLogic:

“. . . record equity continues to provide fuel for housing demand, particularly if households are relocating to more affordable areas.”

Danielle Hale, Chief Economist, realtor.com:

“For homeowners deciding whether to make a move this year, remember that listing prices – while lower than a few months ago – remain higher than in prior years, so you're still likely to find opportunities to cash-in on record-high levels of equity, particularly if you've owned your home for a longer period of time.”

Bottom Line

Mortgage rates, home prices, and the supply of homes for sale are top of mind for buyers and sellers today. And if you want the latest information for our area, let’s connect today.

Mt. Hood Fall Home Selling Checklist

by Liz Warren


Fall Home Selling Checklist [INFOGRAPHIC] | MyKCM
 

Some Highlights

  • When it comes to selling your house, you want it to look its best inside and out so it catches the attention of buyers. A real estate professional can help you decide what to do to make that happen.
  • Focus on tasks that can make it inviting, show it’s cared for, and boost your curb appeal.
  • Let’s connect so you have advice on what you may want to do to get your house ready to sell this season.

Top Reasons Homeowners Are Selling Their Houses on Mt. Hood Right Now

by Liz Warren

Top Reasons Homeowners Are Selling Their Houses On Mt. Hood Right Now

Top Reasons Homeowners Are Selling Their Houses Right Now | MyKCM
 

Some people believe there’s a group of homeowners who may be reluctant to sell their houses because they don’t want to lose the historically low mortgage rate they have on their current home. You may even have the same hesitation if you’re thinking about selling your house.

Data shows 51% of homeowners have a mortgage rate under 4% as of April this year. And while it’s true mortgage rates are higher than that right now, there are other non-financial factors to consider when it comes to making a move. In other words, your mortgage rate is important, but you may have other things going on in your life that make a move essential, regardless of where rates are today. As Jessica Lautz, Vice President of Demographics and Behavioral Insights at the National Association of Realtors (NAR), explains:

Home sellers have historically moved when something in their lives changed – a new baby, a marriage, a divorce or a new job. . . .”

So, if you’re thinking about selling your house, it may help to explore the other reasons homeowners are choosing to make a move today. The 2022 Summer Sellers Survey by realtor.com asked recent home sellers why they decided to sell. The visual below breaks down how those homeowners responded:

Top Reasons Homeowners Are Selling Their Houses Right Now | MyKCM

As the visual shows, an appetite for different features or the fact that their current home could no longer meet their needs topped the list for recent sellers. Additionally, remote work and whether or not they need a home office or are tied to a specific physical office location also factored in, as did the desire to live close to their loved ones.

The realtor.com survey summarizes the findings like this:

The primary reason homeowners decided to sell in the last year was the realization that, after so much time spent at home, they wanted different features and amenities, such as walkability, outdoor space, pool, etc. . . . 

If you, like the homeowners they surveyed, find yourself wanting features, space, or amenities your current home just can’t provide, it may be time to consider listing your house for sale.

Even with today’s mortgage rates, your lifestyle needs may be enough to motivate you to make a change. The best way to find out what’s right for you is to partner with a trusted real estate professional who can provide expert guidance and advice throughout the process. They can help walk you through your options, so you can make a confident decision based on what matters most to you and your loved ones.

Bottom Line

While the financial reasons for moving are important, there’s often far more to consider. Non-financial reasons can also be a significant motivating factor. If you need help weighing the pros and cons of selling your house, let’s connect today.

Housing Experts Forecast for the Rest of 2022 on Mt. Hood

by Liz Warren


Will My House Still Sell in Today’s Market?

by Liz Warren

Will My House Still Sell in Today’s Market?

Will My House Still Sell in Today’s Market? | MyKCM
 

If recent headlines about the housing market cooling and buyer demand moderating have you worried you’ve missed your chance to sell, here’s what you need to know. Buyer demand hasn’t disappeared, it’s just eased from the peak intensity we saw over the past two years.

Buyer Demand Then and Now

During the pandemic, mortgage rates hit record lows, and that spurred a significant rise in buyer demand. This year, as rates increased due to factors like rising inflation, buyer demand pulled back or softened as a result. The latest data from ShowingTime confirms this trend (see graph below):

Will My House Still Sell in Today’s Market? | MyKCM

The orange bars in the graph above represent the last few months of data and the clear cooldown in the volume of home showings the market has seen since mortgage rates started to rise. But context is important. To get the full picture of where today's demand stands, let's look at the July data for the past six years (see graph below):

Will My House Still Sell in Today’s Market? | MyKCM

This second visual makes it clear that, while moderating compared to the frenzy in 2020 and 2021, showing activity is still beating pre-pandemic levels – and those pre-pandemic years were great years for the housing market. That goes to show there’s still demand if you sell your house today.

What That Means for You When You Sell

The key to selling in a changing market is understanding where the housing market is now. It’s not the same market we had last year or even earlier this year, but that doesn’t mean the opportunity to sell has passed.

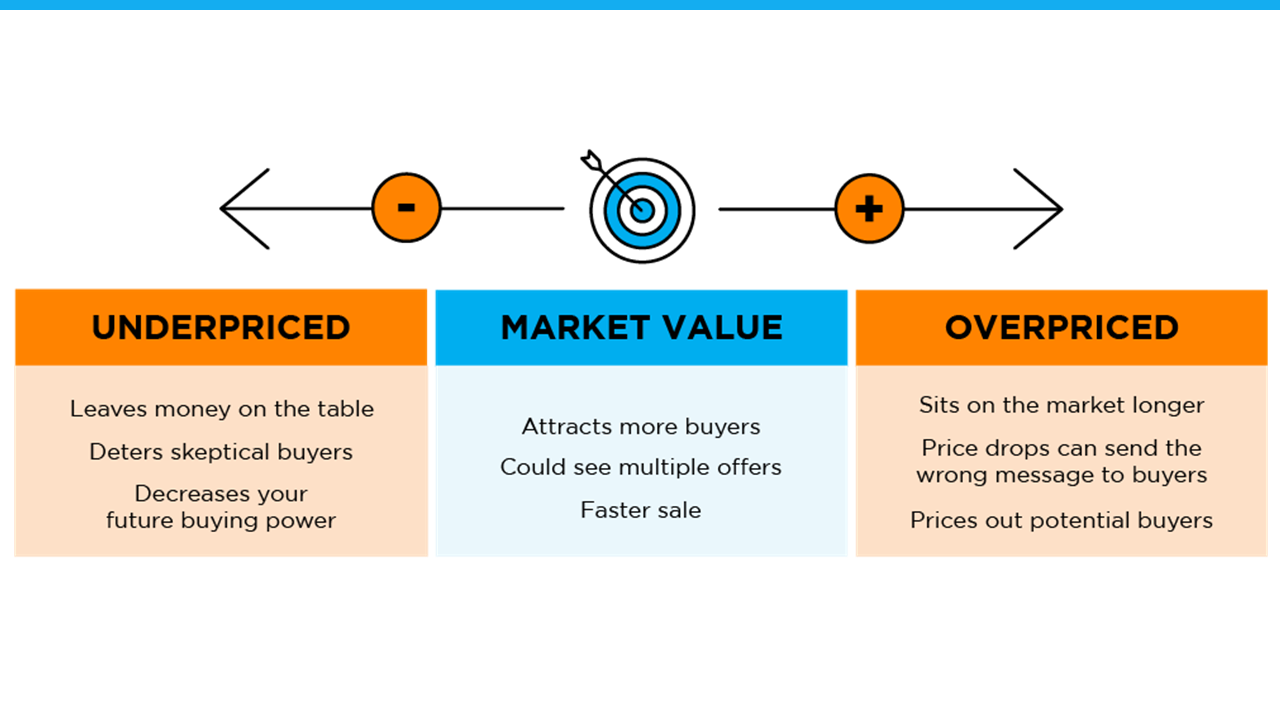
While things have cooled a bit, it’s still a sellers’ market. If you work with a trusted local expert to price your house at the current market valuethe demand is still there, and it should sell quickly. According to a recent survey from realtor.com, 92% of homeowners who sold in August reported being satisfied with the outcome of their sale.

Bottom Line

Buyer demand hasn’t disappeared, it’s just moderated this year. If you’re ready to sell your house today, let’s connect so you have expert insights on how the market has shifted and how to plan accordingly for your sale.

More Housing Blows from DLCD

by Liz Warren

More Blows to Housing from DLCD

Take Action by Friday, September 16th

Less than two months after the Oregon Land Conservation and Development Commission adopted the well-intentioned but ill-advised “Climate Friendly and Equitable Communities” rules that will increase the costs and complications of developing housing in Oregon, DLCD is at it again.

This time, in the name of “Wildfire Adapted Communities” DLCD is again proposing regulations that would dampen Oregon’s housing supply and choice at a time when we face the worst housing crisis in our state’s history, and in the nation.

The draft recommendations include items such as limiting where housing and commercial development can be located, requiring fire breaks in addition to the defensible space requirements for individual lots, and limiting where critical facilities such as schools, hospitals, and community lifelines can be sited.

The Legislature directed DLCD to report back by October 1, 2022 regarding “updates to the statewide land use planning program and local comprehensive plans and zoning codes that are needed in order to incorporate wildfire risk maps and minimize wildfire risk.”

The problem is, there are no maps.  The Wildfire Risk Maps were pulled last month after major errors were identified and after strong public and community backlash. 

Yet despite the fact that we don’t know where the regulations will apply, DLCD is charging ahead with them.  That’s nonsensical.  And now DLCD is using undefined terms like "areas of greatest wildfire risk” that, if interpreted broadly, could affect vast portions of the state.

To make matters worse, DLCD’s proposed requirements would apply above and beyond the new defensible space and home hardening regulations that are already being developed by other state agencies.

It’s important to protect our communities from wildfire risks.  But we can’t develop regulations when we don’t know where they will apply.  And any new regulations must not exacerbate Oregon’s housing crisis.

This is unjustifiable, and we must act now to stop it. Please email LCDC through the link below by Friday night and tell them not to advance their recommendation on new development considerations.

Written public comments delivered to the Commission Assistant at least 10 days prior to the meeting can be copied and distributed to the commission.

To submit comments electronically, please email the Commission Assistant at: est​[email protected]

To mail in comments, please use this address:

Land Conservation and Development Commission
Attn: Esther Johnson, Commission Assistant
Oregon Department of Land Conservation and Development
635 Capitol Street NE, Ste. 150
Salem, OR 97301

Displaying blog entries 211-220 of 1881

Syndication

Categories

Archives