Foreclosure Numbers Today are Nothing like 2008!
Tuesday, May 9, 2023
Add Comment
Displaying blog entries 151-160 of 436

We’re still in a sellers’ market. And if you’re looking to buy a home, that means you’re likely facing some unique challenges, like difficulty finding a home and volatile mortgage rates. But keep in mind, there are some benefits to being a buyer in today’s market that give you good reason to stick with your search. Here are a few of them.
Owning a home grows your net worth – and since building that wealth takes time, it makes sense to start as soon as you can. If you wait to buy and keep renting, you’ll miss out on those monthly housing payments going toward your home equity. Freddie Mac puts it this way:
“Homeownership not only builds a sense of pride and accomplishment, but it’s also an important step toward achieving long-term financial stability.”
The key there is long-term because the financial benefits homeownership provides, like home value appreciation and equity, grow over time. Those benefits are worth the short-term challenges today’s sellers’ market presents.
Mortgage rates have been hovering around 6.5% over the last several months. However, as Sam Khater, Chief Economist at Freddie Mac, notes, they’ve been coming down some recently:
“Economic uncertainty continues to bring mortgage rates down. Over the last several weeks, declining rates have brought borrowers back to the market . . .”
Lower mortgage rates improve your purchasing power when you buy, and that can help make homeownership more affordable. Hannah Jones, Economic Data Analyst at realtor.com, explains:
“As we move into the spring buying season, mortgage rates have ticked lower, a welcomed sign of progress towards affordability.”
The recent drop in mortgage rates is good news if you couldn’t afford to buy a home when they peaked.
According to the Home Price Expectation Survey, which polls over 100 real estate experts, home values will go up steadily over the next few years after a slight decline this year (see graph below):
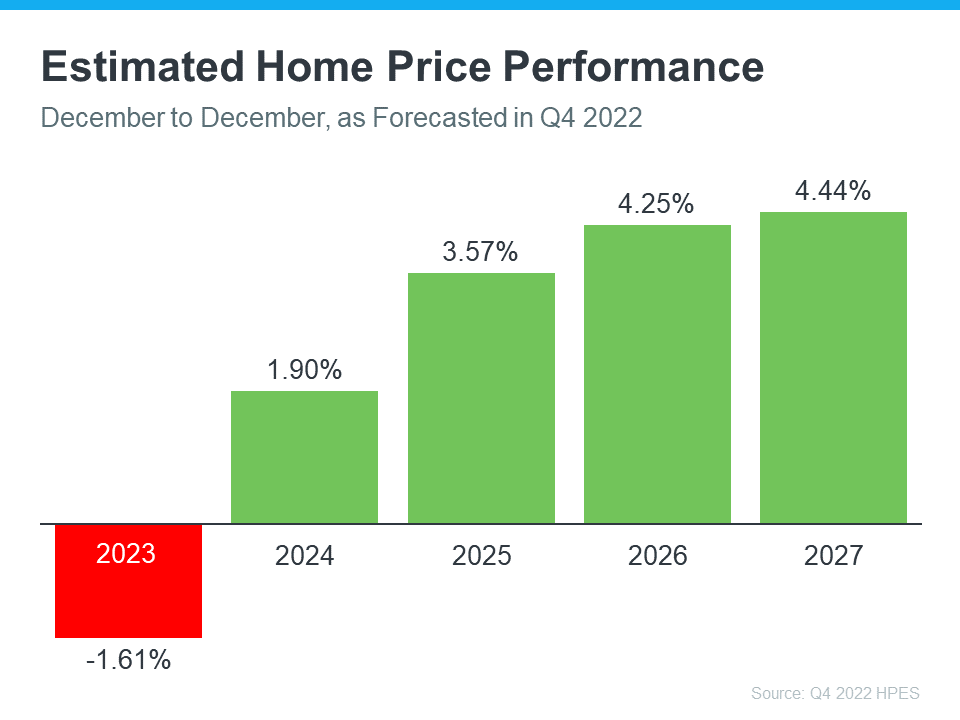
Rising home prices in the coming years means two things for you as a buyer:
If you’ve been trying to buy a home, hang in there. Mortgage rates have ticked down some recently, home prices are forecast to increase in the coming years, and the long-term benefits of homeownership outweigh many of the short-term challenges.

There have been a lot of shifts in the housing market recently. Mortgage rates rose dramatically last year, impacting many people’s ability to buy a home. And after several years of rapid price appreciation, home prices finally peaked last summer. These changes led to a rise in headlines saying prices would end up crashing.
Even though we’re no longer seeing the buyer frenzy that drove home values up during the pandemic, prices have been relatively flat at the national level. Lawrence Yun, Chief Economist at the National Association of Realtors (NAR), doesn’t expect that to change:
“[Home prices will be steady in most parts of the country with a minor change in the national median home price.”
You might think sellers would have to lower prices to attract buyers in today’s market, and that’s part of why some may have been waiting for prices to come crashing down. But there’s another factor at play – low inventory. And according to Yun, that’s limiting just how low prices will go:
“We simply don’t have enough inventory. Will some markets see a price decline? Yes. [But] with the supply not being there, the repeat of a 30 percent price decline is highly, highly unlikely.”
As you can see in the graph below, we’ve been at or near record-low inventory levels for a few years now.
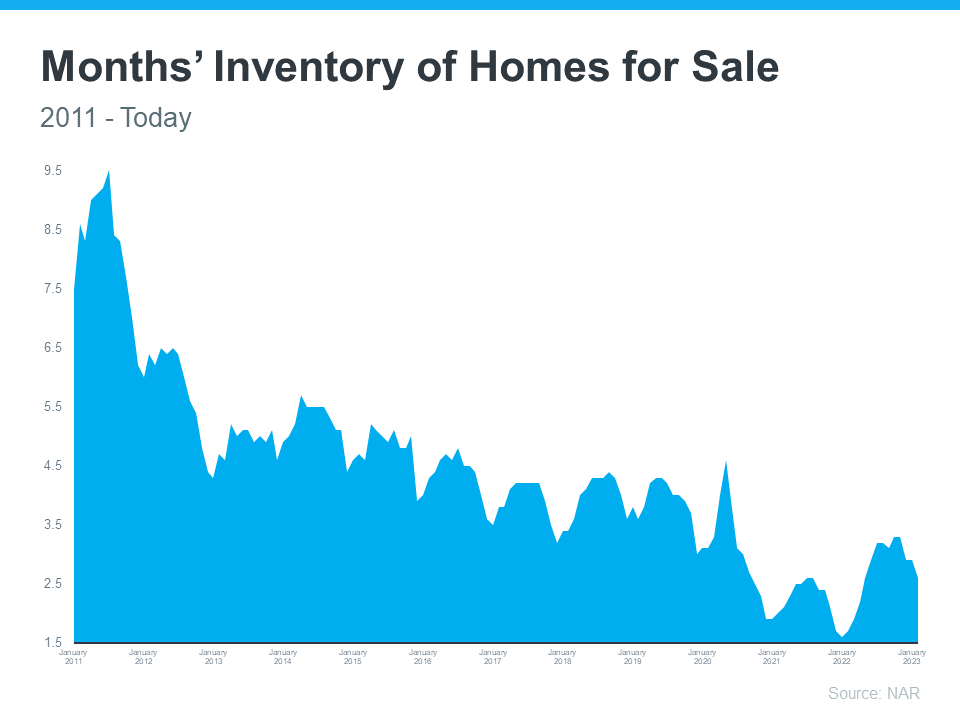
That lack of available homes on the market is putting upward pressure on prices. Bankrate puts it like this:
“This ongoing lack of inventory explains why many buyers still have little choice but to bid up prices. And it also indicates that the supply-and-demand equation simply won’t allow a price crash in the near future.”
If more homes don’t come to the market, a lack of supply will keep prices from crashing, and, according to industry expert Rick Sharga, inventory isn’t likely to rise significantly this year:
“I believe that we’re likely to see low inventory continue to vex the housing market throughout 2023.”
Sellers are under no pressure to move since they have plenty of equity right now. That equity acts as a cushion for homeowners, lowering the chances of distressed sales like foreclosures and short sales. And with many homeowners locked into low mortgage rates, that equity cushion isn’t going anywhere soon.
With so few homes available for sale today, it’s important to work with a trusted real estate agent who understands your local area and can navigate the current market volatility.
A lot of people expected prices would crash this year thanks to low buyer demand, but that isn’t happening. Why? There aren’t enough homes for sale. If you’re thinking about moving this spring, let’s connect.

The 30-year fixed mortgage rate has been bouncing between 6% and 7% this year. If you’ve been on the fence about whether to buy a home or not, it’s helpful to know exactly how a 1%, or even a 0.5%, mortgage rate shift affects your purchasing power.
The chart below helps show the general relationship between mortgage rates and a typical monthly mortgage payment:
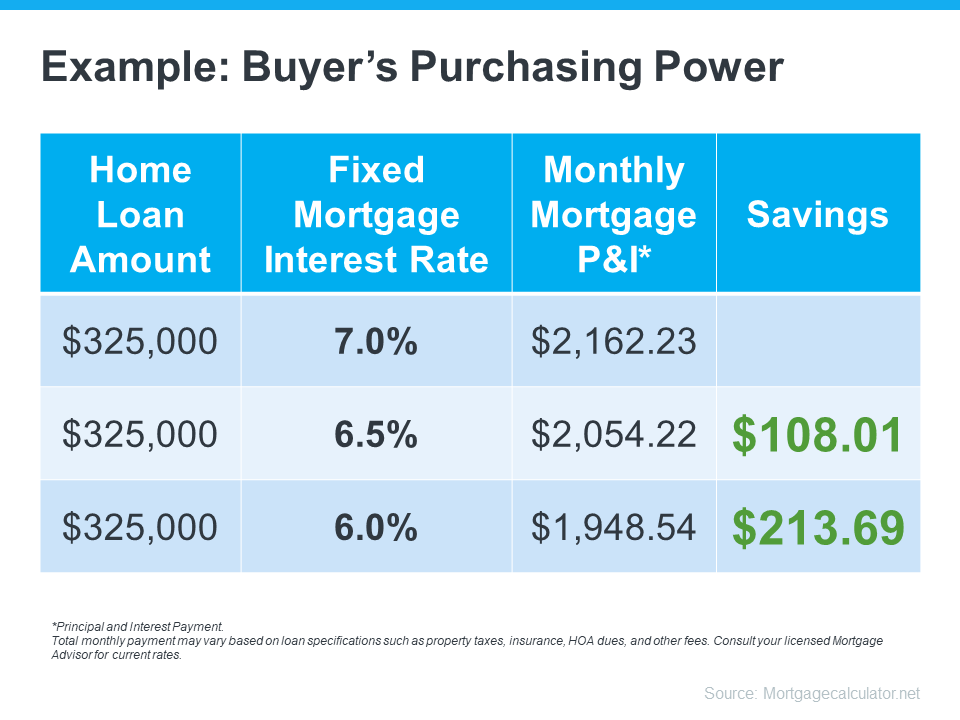
Even a 0.5% change can have a big impact on your monthly payment. And since rates have been moving between 6% and 7% for a while now, you can see how it impacts your purchasing power as rates go down.
You may be tempted to put your home buying plans on hold in hopes that rates will fall. But that can be risky. No one knows for sure where rates will go from here, and trying to time them for your benefit is tough. Lisa Sturtevant, Housing Economist at Bright MLS, explains:
“It is typically a fool’s errand for a homebuyer to try to time rates in this market . . . But volatility in mortgage rates right now can have a real impact on buyers’ monthly payments.”
That’s why it’s critical to lean on your expert real estate advisors to explore your mortgage options, understand what impacts mortgage rates, and plan your home buying budget around today’s volatility. They’ll also be able to offer advice tailored to your specific situation and goals, so you have what you need to make an informed decision.
Your ability to buy a home could be impacted by changing mortgage rates. If you’re thinking about making a move, let’s connect so you have a strong plan in place.

Even though activity in the housing market has slowed from the frenzy we saw over a year ago, today’s low supply of homes for sale is still a sellers’ market. But what does that really mean? And why are conditions today so good if you want to list your house?
It starts with the number of homes available for sale. The latest Existing Home Sales Report from the National Association of Realtors (NAR) shows housing supply is still astonishingly low. Today, we have a 2.6-month supply of homes at the current sales pace. Historically, a 6-month supply is necessary for a ‘normal’ or ‘neutral’ market in which there are enough homes available for active buyers (see graph below):
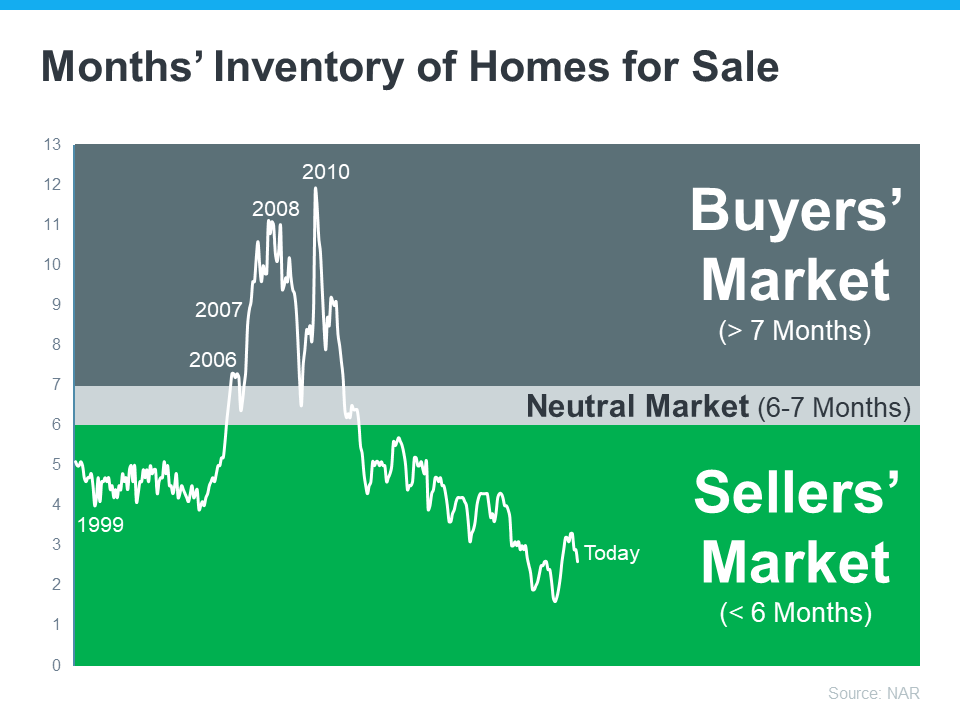
When the supply of homes for sale is as low as it is right now, it’s much harder for buyers to find one to purchase. That creates increased competition among purchasers and keeps upward pressure on prices. And if buyers know they’re not the only one interested in a home, they’re going to do their best to submit a very attractive offer. As this happens, sellers are positioned to negotiate deals that meet their ideal terms. Lawrence Yun, Chief Economist at NAR, says:
“Inventory levels are still at historic lows. Consequently, multiple offers are returning on a good number of properties.”
Right now, there are still buyers who are ready, willing, and able to purchase a home. If you list your house right now in good condition and at the right price, it could get a lot of attention from competitive buyers.
Today’s sellers’ market holds great opportunities for homeowners ready to make a move. Listing your house now will maximize your exposure to serious, competitive buyers. Let’s connect to discuss how to jumpstart the selling process.

Are you planning to buy a home this spring? Though things are more balanced than they were at the height of the pandemic, it’s still a sellers’ market. So, when you find the home you want to buy, remember these four tips to make your best offer.
Rely on an agent who can support your goals. As Bankrate notes:
“. . . select the best real estate agent for your needs. They will be a critical part of your home buying process.”
Agents are local market experts. They know what’s worked for other buyers in your area and what sellers may be looking for in an offer. It may seem simple, but catering to what a seller needs can help your offer stand out.
Understanding your budget is especially important right now. As Sandy Higgins, Senior Wealth Advisor at Capstone Financial Advisors, puts it:
“Understand your current budget … what are your expenses, how’s your spending, would you need to make changes?”
The best way to understand your numbers is to work with a lender so you can get pre-approved for a loan. It helps you be more financially confident, and it shows sellers you’re serious. That can give you a competitive edge.
Today’s market isn’t moving at the record pace it did during the pandemic. That means you may have a bit more time to think before you need to make an offer. According to Danielle Hale, Chief Economist at realtor.com:
“In general, you likely have more time to make an offer, although that’s certainly not a guarantee. If you’re on the fence about a home or its asking price doesn’t quite fit your budget, you might want to keep an eye on it, and if it doesn’t sell right away, you may have some room to negotiate with the seller.”
While it’s still important to stay on top of the market and be prepared to move quickly, there can be more flexibility today. Lean on the advice of your agent as you explore the options in your market.
During the pandemic, some buyers skipped home inspections or didn’t ask for concessions from the seller in order to submit the winning bid on a home. Fortunately, today’s market is different, and you may have more negotiating power than before. When putting together an offer, your trusted real estate advisor will help you think through what levers to pull.
When you buy a home this spring, let’s connect so you have the guidance to make your best offer.

A lot has changed over the past year, and you might be wondering what’s in store for the spring housing market. If you’re planning to sell your house this season, here’s what real estate experts are saying you should keep in mind.
Houses that are updated and priced at their current market value are still selling. Jeff Tucker, Senior Economist at Zillow, says:
“. . . sellers who price and market their home competitively shouldn’t have a problem finding a buyer.”
The need to price your house right is so important today because the market has changed so much over the past year. Danielle Hale, Chief Economist at realtor.com, explains:
“With a smaller pool of buyers today and more competition from other homes on the market, homesellers will likely need to adjust their price expectations in the market this spring.”
While this spring housing market is different than last year’s, sellers with proper expectations who lean on a real estate expert for the best advice on pricing their house well are still finding success. And that’s great news if you’re thinking about selling.
As mortgage rates have risen and remain volatile, some buyers have pressed pause on their plans. But there are still plenty of reasons people are buying homes today. Lisa Sturtevant, Chief Economist at Bright MLS, spells out the mindset of today’s buyers:
“For some buyers, higher mortgage rates simply means buying a home is out of the question unless home prices fall. For others, higher mortgage rates will be a hurdle but ultimately will not keep them from getting back into the market after sitting on the sidelines for months.”
That’s why, if you’re interested in selling your house this spring, it’s helpful to work with a real estate agent who can help connect you with those buyers who are ready to purchase a home.
There are still clear opportunities for sellers this spring. If you’re wondering if it’s the right time to make a move, let’s connect today.

You may have seen reports in the news recently saying it’s better to rent right now than it is to own your home. But before you let that impact your decisions, you should understand what these claims are based on.
A lot of the time, these reports are assuming things that aren’t realistic for the average household. For example, the methodology behind one of those reports says that renting is the smarter financial option because of the opportunity to invest money elsewhere. It assumes renters take the money they’d spend on costs tied to buying a home and put it in an investment portfolio.
But here’s the thing – most people who rent aren’t making those investments. Ken Johnson, Co-Author of the BH&J National Price-to-Rent Index, explains:
“One of the difficulties with the rent and reinvest model is many people . . . simply rent and spend the difference. . . . That’s wealth destroying.”
The reason homeownership is one of the best investments you can make is the wealth it helps you build. That’s why there’s a significant difference between the net worth of the average homeowner and the average renter (see graph below):
So, before you renew your rental agreement, think about the opportunity to build wealth that homeownership provides.
If you’re unsure whether to continue renting or to buy a home, let’s connect to help you make the best decision.
Displaying blog entries 151-160 of 436