Real Estate Information Archive

Blog

Displaying blog entries 111-120 of 357

Average Sale Price increases in 2018 on Mt. Hood

by Liz Warren

A lack of inventory has driven sales prices up over the past year and here are the current numbers for January. Active listings sit at 44.  Pending sales comparing this January to last January are up 40%! Of course, that could have been due to the crazy January deep freeze we experienced. 

As inventory decreases our median and average pricing points have gone up. Medium price currently sits at $312,000. Last year we sat at $264,800 and in 2016 it was a lowly $235,300. 

Once spring hits we'll know how this will play out and if we'll have some homes to sell. Many buyers are making their land purchases for future development with such a low home supply. If we had some new homes to sell they would fly off the shelf. 

We have a major need for any and all types of homes and cabins so if you're thinking about it, now is the time to get things going!


January 2018 real estate sales for the Mt. Hood Area 97067,97028,97011 and 97049

December Sales on Mt. Hood

by Liz Warren

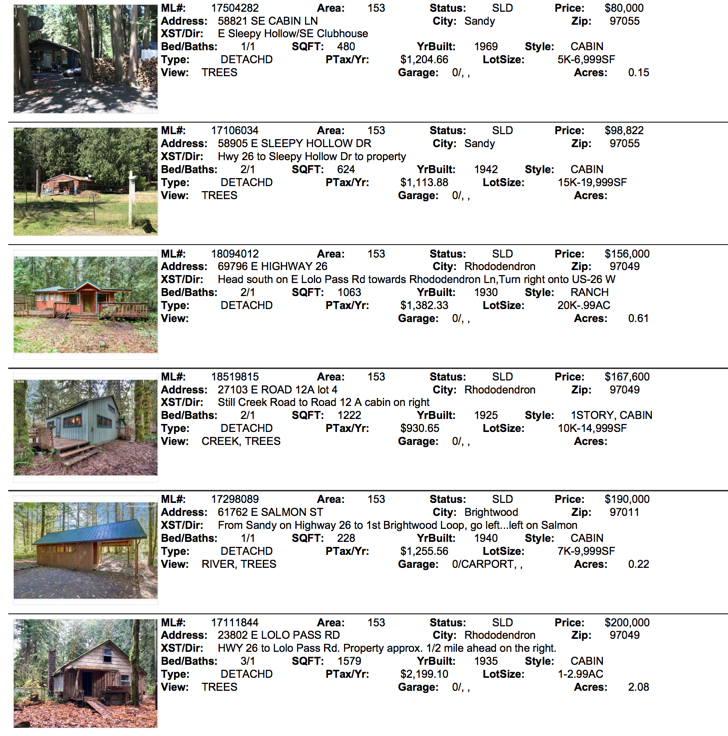
Numbers are in for December 2017 totaling 17 sales for the month!

Mt. Hood Real Estate Sales for December 2017
Mt. Hood Real Estate Sales 2017 for 97028,97067,97049,97011

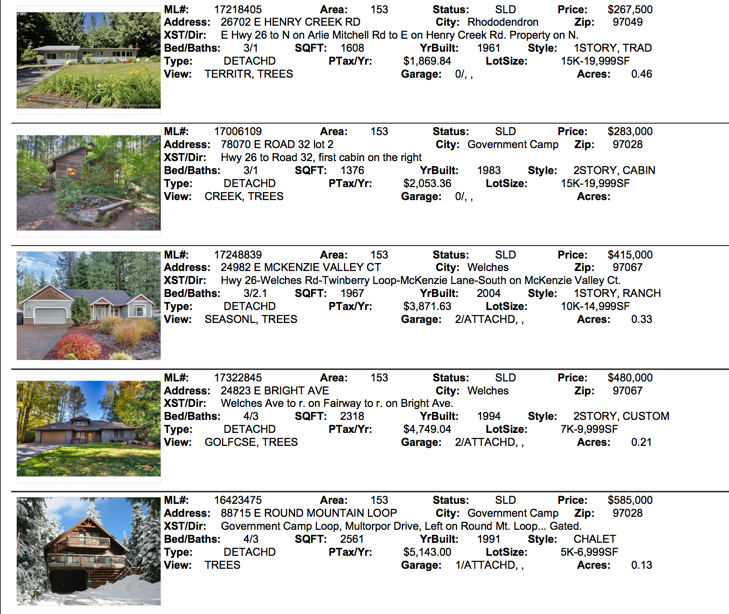
Mt. Hood Real Estate Sales for Government Camp, Welches, Brightwood, and Rhododendron OregonMt Hood National Forest cabins totaled four sales and condos did well with three closed. The balance of closed sales were spread throughout the area. You can tell inventory is down when the Government Camp house on Round Mountain Loop finally sold after four years of being on the market!

Tax Reform and Housing: A Reference Guide

by Liz Warren

Tax Reform & Housing: A Reference Guide


This information comes immediately after the new tax code became law. Some of the information may be revised as the analysis of the new law evolves.

When the tax code was originally being overhauled by the House and the Senate, there were three major proposals being considered that would have substantially impacted the residential real estate market:

  • Changing the requirements for the exclusion of gain on the sale of a principal residence
  • The reduction on the limit of the Mortgage Interest Deduction (MID)
  • The elimination of the State and Local Tax deduction (SALT) which includes property taxes

Let’s look how the tax code has evolved from the original proposal, and decipher what impact experts believe it may have on the housing market.

1. Exclusion of gain on sale of a principal residence

Original Proposal: Owners would need to live in their house for at least 5 out of the last 8 years to claim this exemption. Under the former tax framework, a typical owner, who has lived in their house for at least 2 years out of the last 5 years, would pay nothing in capital gain taxes if they sell the house.

The New Tax Code: No change. The “at least 2 years out of the last 5 years” requirement is unchanged.

Impact on the Market: None.

2. Mortgage Interest Deduction

Original Proposal: Reduce the limit on the mortgage interest deduction (MID) amount from $1,000,000 to $500,000.

The New Tax Code: Reduces limit on deductible mortgage debt to $750,000 for new loans taken out after 12/14/17. Current loans up to $1 million are grandfathered.

Impact on the Market: Assuming a 20% down payment, this reduction in the MID will impact buyers that are purchasing a home between the prices of $938,000 and $1,250,000. Any home under the lower price is still covered and any home over the higher price was not covered under the former tax code either.

What does that mean to the market? Experts disagree. Calculated Risk’s Bill McBride:

“I think the impact of reducing the MID from a maximum of $1 million in mortgage debt to $750 thousand in mortgage debt will have very little impact on the housing market.”

On the other hand, Capital Economics claims:

“The impact on expensive homes could be detrimental, with a limit on the mortgage interest deduction raising taxes for those that itemize.”

3. State and Local Taxes (SALT)

Original Proposal: The elimination of the state and local tax deduction (which includes property taxes).

The New Tax Code: Allows an itemized deduction of up to $10,000 for the total of state and local property taxes and income or sales taxes.

Impact on the Market: Most experts agree that higher taxed regions will be impacted as homeowners in those communities now have a cap on these deductions.

Calculated Risk’s Bill McBride stated:

“SALT will have an impact on housing in some areas. Some people might choose to live in one state over another (if they have a choice), based on taxation. This could impact demand in certain states – especially for the middle and upper-middle class homeowners.”

Mark Zandi of Moody’s Analytics said:

“The impact on house prices is much greater for higher-priced homes, especially in parts of the country where incomes are higher and there are thus a disproportionate number of itemizers, and where homeowners have big mortgages and property tax bills.”

What will be the overall impact on the housing market?

For most of the country, the new tax code will not have a negative impact on the market. As Capital Economics reports:

“Given most households will see an overall tax cut, and potential buyers are likely to put that saving towards their home, we doubt it will have a significant detrimental impact on the housing market.”

There is also no doubt that some higher priced, higher taxed regions will be affected more than others. However, most experts agree that other portions of the tax code will favor the high-end buyer and seller, and this might mitigate many concerns. McBride explains:

“The corporate tax cuts (and other tax cuts) will mostly benefit the wealthy, and this will be a positive for high end real estate.”

What does this all mean to you?

To know for sure, you should sit with your accountant or financial planner and explore how all the aspects of the new code will impact your family.

Most families consider homeownership an essential part of the American Dream, and don’t purchase a home based solely on the tax advantages. The main reasons they buy a home are personal (they just got married, they are looking for a good place to raise children, they want to be near friends and family, they want to better enjoy their retirement, etc.). This will never change.

Looking at the new tax code, Mr. McBride’s opinion makes the most sense:

“There will be some negative impact based on SALT, but overall the impact of these policy changes on housing will be minimal.”
November Real Estate Sales for Mt. Hood area in 2017

by Liz Warren


Mt. Hood sale numbers have surged this year and the minimal inventory has caused prices to continue to climb. As seen with this November 2017 report from multiple listing, compared to 2016 our prices have climbed nearly 19% over last year. The average sales price has bumped up to $309,400! 

November Real Estate Sales for Mt. Hood Area

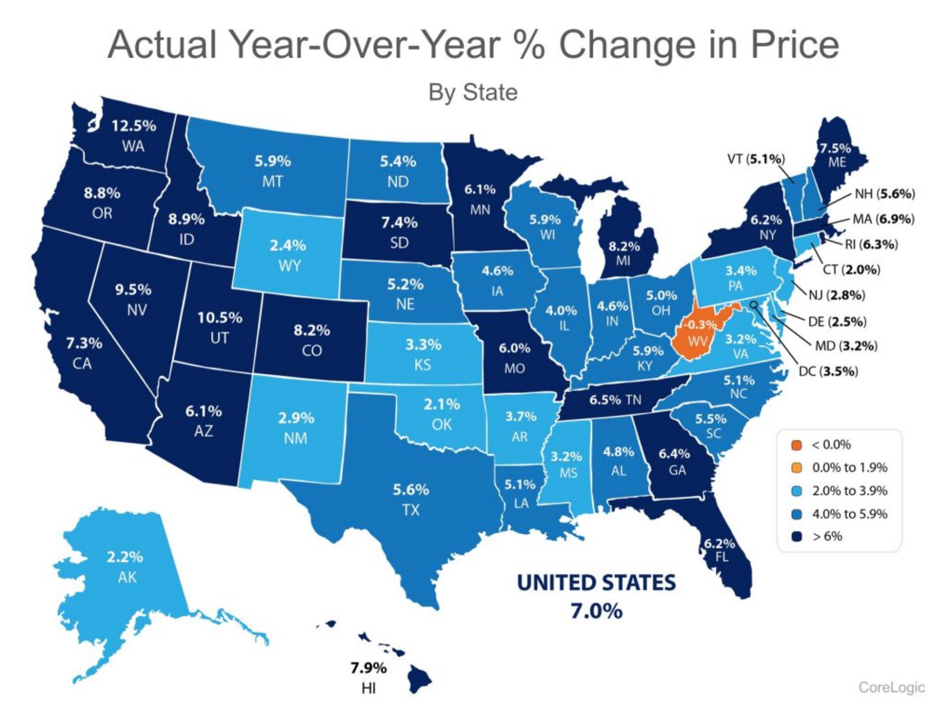
Oregon seems to be fairing very well in the scheme of things. Take a look at this map showing price appreciation of the whole state over the past year compared to the rest of the country. There's nearly a 9% difference from last year!

Year over Year appreciation for Oregon


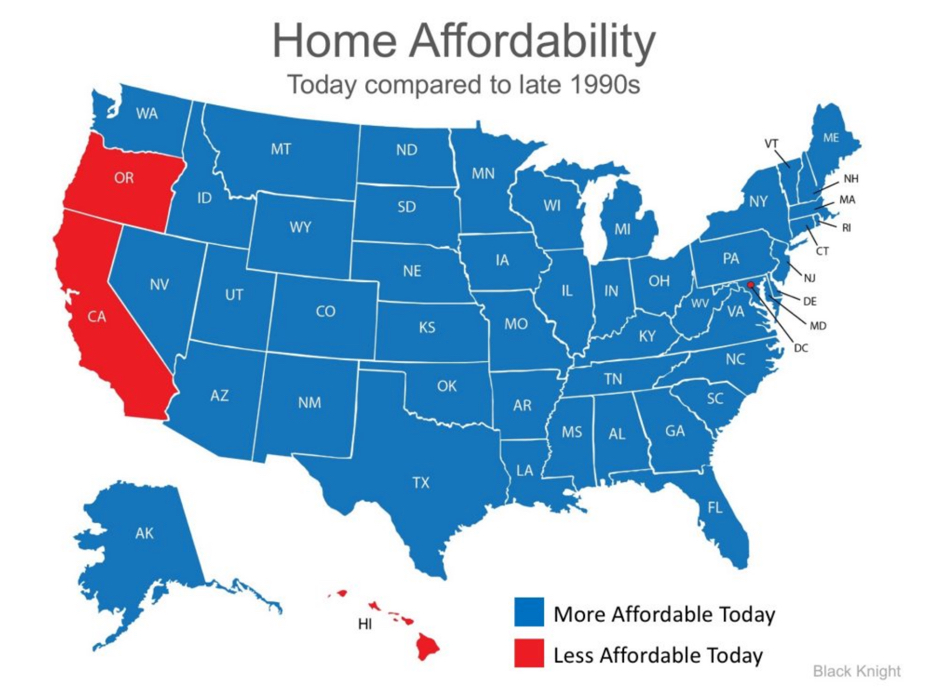
Here's another interesting map of home affordability, or should I say unaffordable as compared  to late 1990's. Oregon ranks right up there with California, Hawaii, and Washington DC. This shows how much Oregon's prices have gone up recently. It actually shows that the state was probably at dirt cheap prices in late 1990 but we've really escalated over the past two decades!

Oregon Home Affordability has skyrocketed

October Mt. Hood Sales Top 26 for the Month

by Liz Warren

Fall sales are plugging along at a steady pace following the summer of activity. October saw 26 sales closings which likely were a result of August and September's activities. Each new listing that hits the market sees a flurry of activity sometimes resulting in multiple offers. 

Mt. Hood October sales for 2017

Recent RMLS statistics show a decline of nearly 26% comparing October 2016 to October  2017 and a total of a 15% decline year to date. This decline can easily be explained  by a lack of inventory in the market. Less homes to buy, less sales. 

Lets take a look at pricing points available in the November market for single family detached homes for sale. There are 49 available properties. About 25% of our current inventory is under $300,000! This is why people believe the market is slowing but not really, it's because of a lack of inventory. 

<$100,000                        1

$100,000-200,000            4
 
$200,000-$300,000          8
 
$300,000- $400,000         9
 
$400,000-$500,000          8
 
$500,000-$700,000         12
 
>$700,000                         7

Mt. Hood Summer Sales Boom!

by Liz Warren

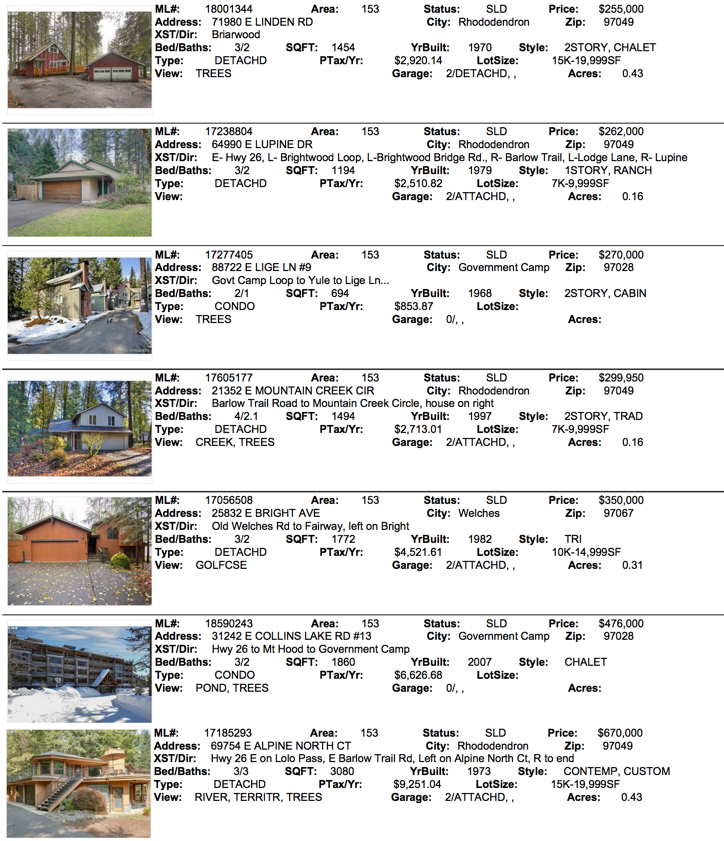
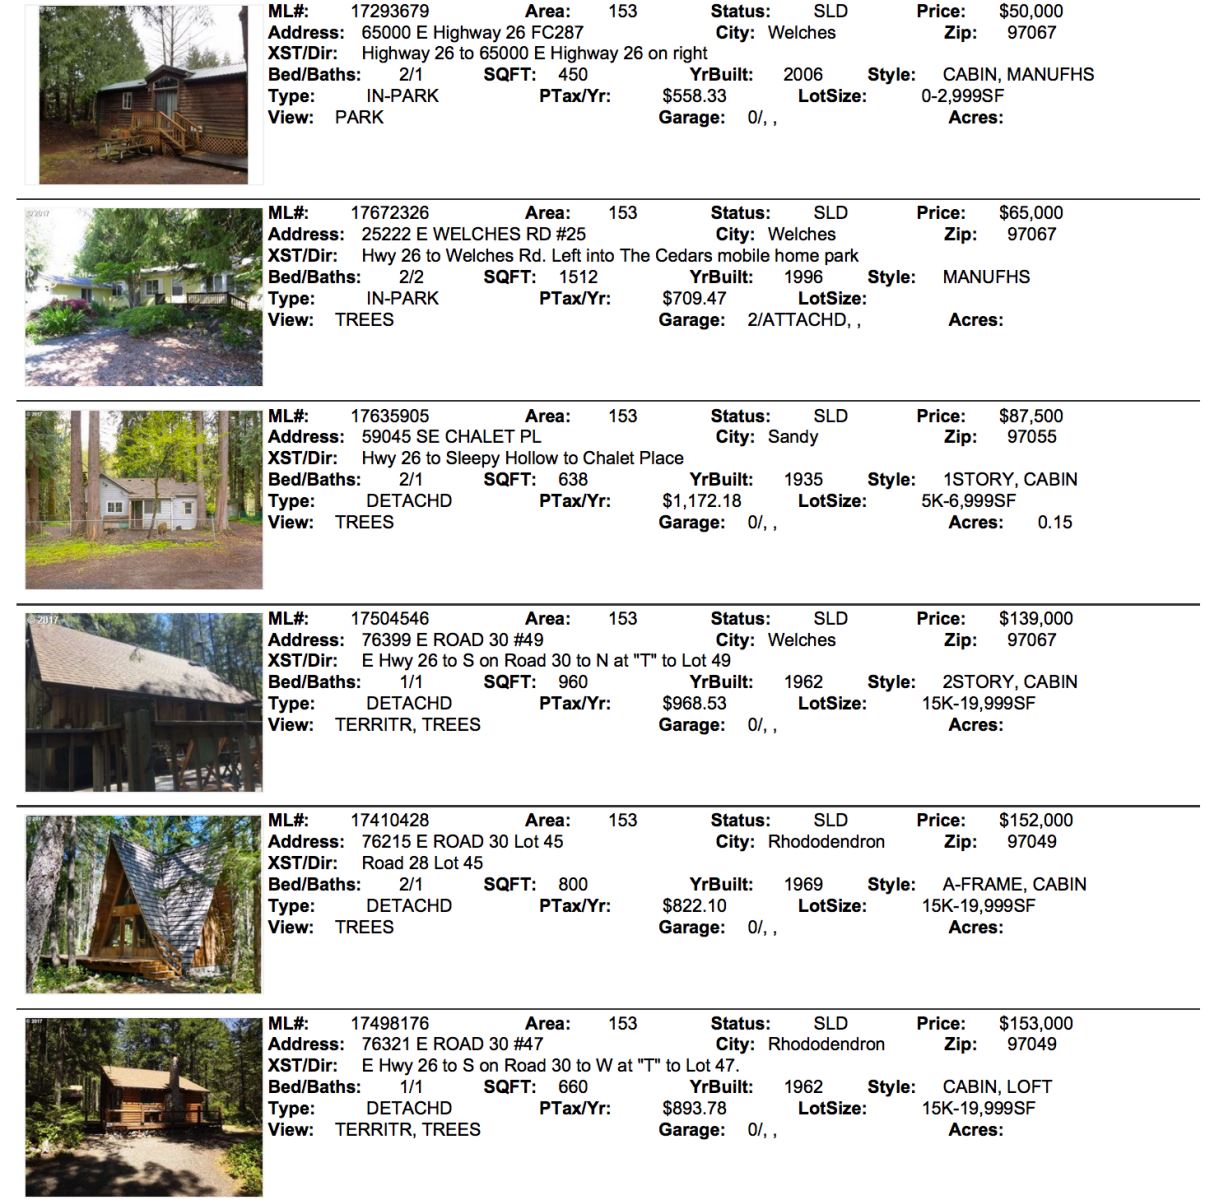
Mt. Hood summer sales boomed with 20 closed sales for the month of August! Believe it or not there were a few sales under $100,000 which is nearly unheard of these days. 

Mt. Hood National forest service cabins dominated the closings with seven sales! One cabin broke all sale records for a price of $337,000! Cabins maintain their popularity on the mountain for their uniqueness and pristine settings which can't be matched by any other properties in the area. 

On another note, Timberline Rim prices are escalating nicely. There's a lack of inventory and with the Rim having a more affordable pricing point, many folks are opting to purchase here for full time living and as a vacation spot. 

Listed below are the 20 sales for August 2017.

Mt. Hood Real estate sales for August 2017 for 97028,97067,97011, and 97049

Mt. Hood Real Estate Sales for August 2017 for Brightwood, Welches, Government Camp and RhododendronMt. Hood Real Estate sales Boon  in August 2017Mt. Hood Sales Boom in August 2017 for Welches, Rhododendron, Brightwood and Government CampReal Estate sales boom for Mt. Hood the summer of 2017

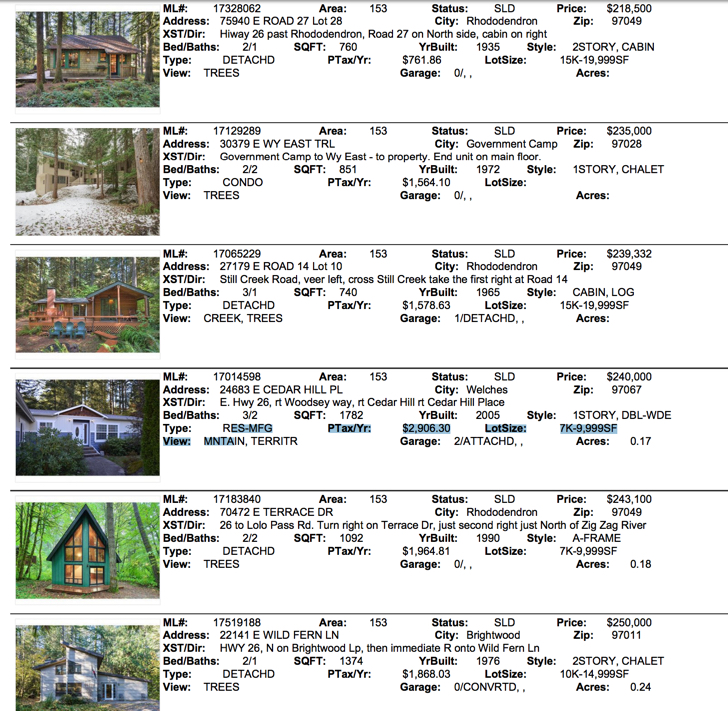
Check out the June sales statistics from RMLS! The average price of the 14 sales reached $343,300 with year to date average sales price hitting $312,200. These numbers tell the tale of less inventory and rising prices on the mountain.

As of today there are 66 properties for sale with 26 of those over $400,000. Twelve properties are under $200,000 with several in parks, which have rental fees or on leased land in the Mt. Hood National Forest. June saw 32 new listings hit the market and for July there's been a steady stream of new listings.

The rainy spring really delayed sellers getting their properties ready for market. With the shortage of contractors, landscapers, and general services on the mountain getting work done has been a real challenge bringing late comers to the summer market. 


Mt. Hood Real Estate Sales Statistics for June 2017

Mt. Hood Real Estate Sales for May 2017

by Liz Warren

Today's Mt. Hood real estate market has small inventory and rising prices. Here is the info direct from RMLS for the month of May. Only 44 active listings for sale. Some properties are trickling in for the summer season. Only eight homes closed for the month and an escalating average sales price has climbed substantially from the $200,000 range. Entry level homes are nearly impossible to find with multiple offers as soon as they hit the market. Shortened marketing days show the high demand in this seller's market. The sub $300,000 market has been depleted showing the 17% average sales price change in the last row. Keep in mind, these stats are based on a very small market with minimal inventory.


      Mt. Hood Sales stats for May 2017

Mt. Hood Sales for April 2017

by Liz Warren

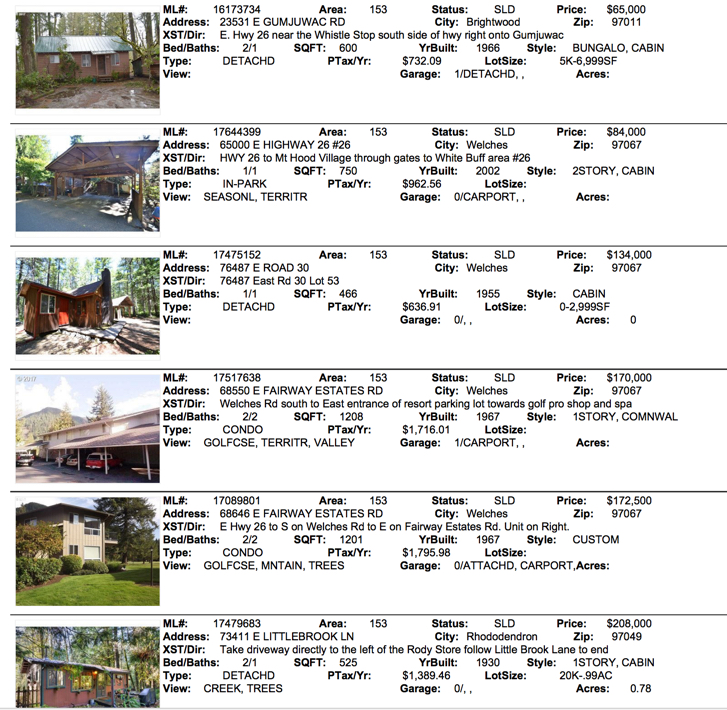
Here are April's sales in the Mt. Hood area. We totaled 17 properties closing for the month. Inventory is dwindling. Some new properties should be coming available as we get closer to summer. 

Mt. Hood Real Estate sales for April 2017Mt. Hood Sales for 97067, 97049,97028.97011

Mt. Hood Reall Estate Sales April 2017 for Welches, Brightwood, Brightwood, Sandy

Pending Sales Plummet Due to Low Inventory on Mt. Hood

by Liz Warren

Numbers are out for April from RMLS for the Mt. Hood area. Minimal inventory has caused pending sales to plummet compared to last year at this time. Although common for the Portland metro area, many properties that hit the market have multiple offers and bidding wars. Who knows what will happen over the summer. Stats below shows an average 12% price change from year to date. With little inventory this number tends to be skewed compared to other areas but we expect prices to rise due to supply and demand. 

At the time of this report we had 42 active listings but currently on 26 properties are for sale. 


April 2017 sales in the Mt. Hood Area

Displaying blog entries 111-120 of 357

Syndication

Categories

Archives